Figure 10
Download original image
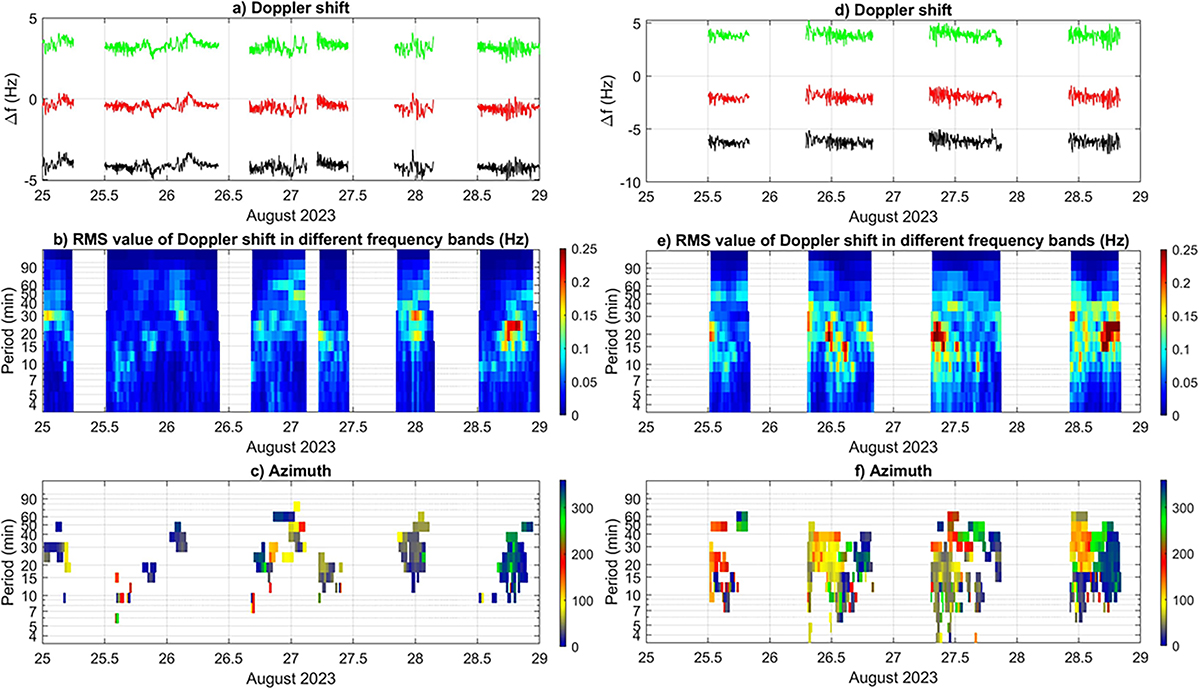
The top panel shows Doppler shift (signals from individual transmitters are artificially offset by about 4 Hz) for the analysed period at 4.65 MHz (left side, a–c) and at 7.04 MHz (right side, d–f), while the panels in the middle and at the bottom give information on RMS values of Doppler shift in different frequency (period) bands and azimuths of the wave propagation, respectively.
Current usage metrics show cumulative count of Article Views (full-text article views including HTML views, PDF and ePub downloads, according to the available data) and Abstracts Views on Vision4Press platform.
Data correspond to usage on the plateform after 2015. The current usage metrics is available 48-96 hours after online publication and is updated daily on week days.
Initial download of the metrics may take a while.