Figure 2
Download original image
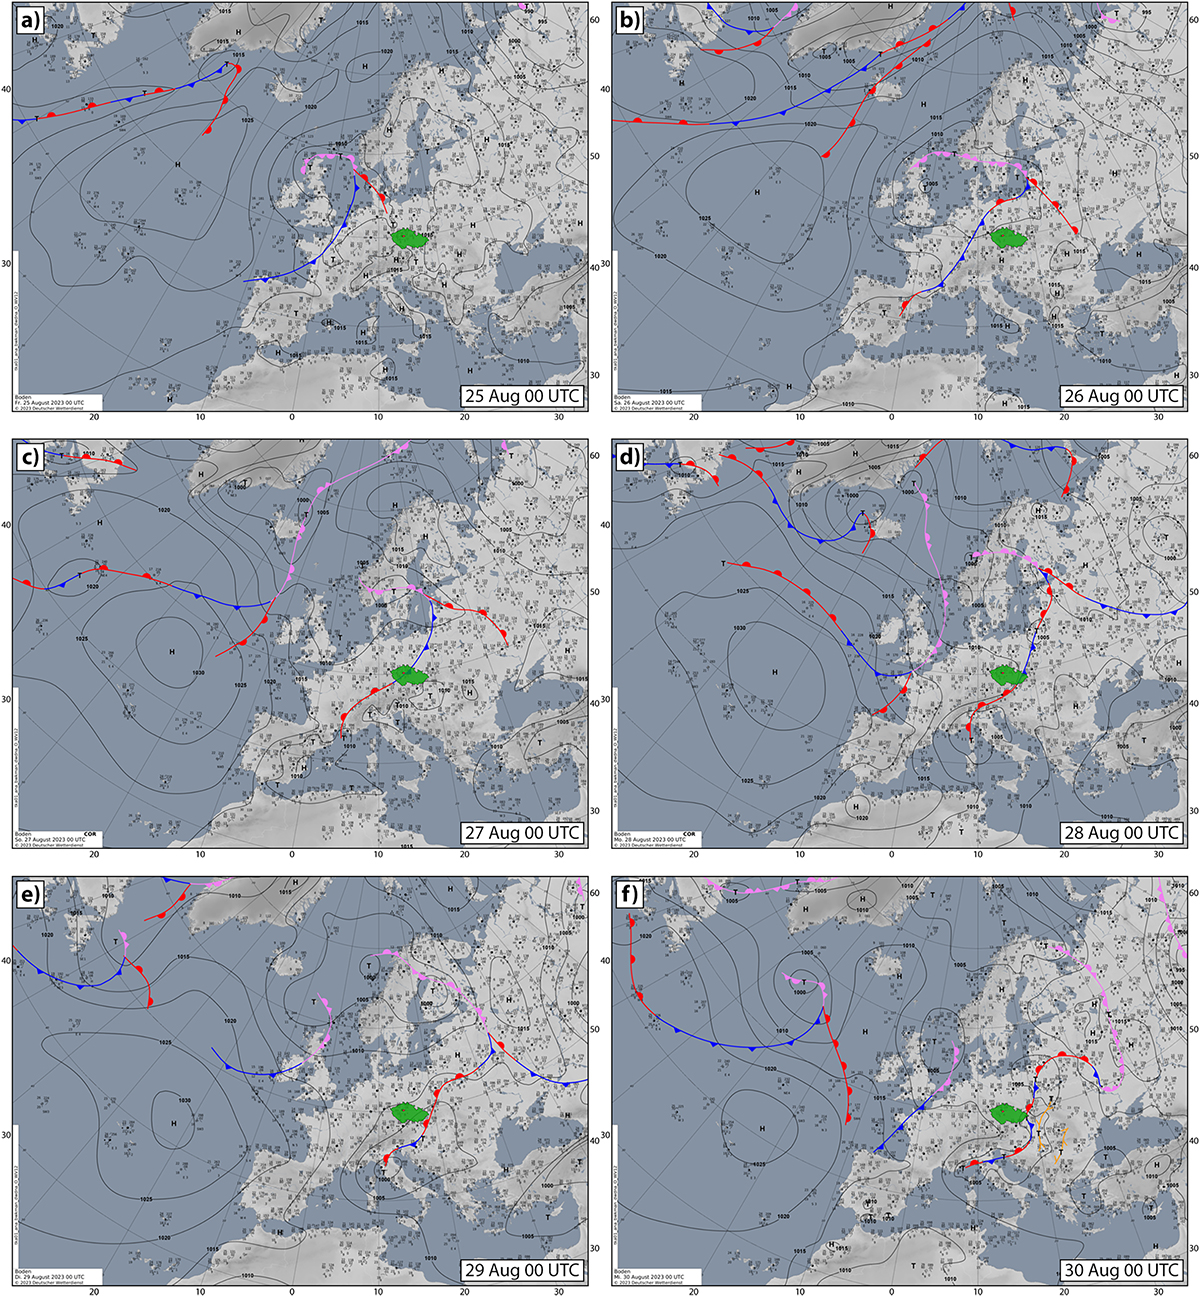
Surface pressure maps provided by the Deutscher Wetterdienst available at https://www.wetterzentrale.de/de/reanalysis.php?map=1&model=dwd&var=45, accessed on 19 January 2025, geographical coordinates and a layer with a map of the Czech Republic was added. Surface pressure is represented by solid lines with 10 hPa steps. Atmospheric fronts (red line with semicircles indicating the direction of the warm front, blue line with blue triangles indicating the direction of the cold front, and purple lines with alternating triangles and semicircles indicating the direction of the occluded front) and the locations of the centres of high (H) and low (T) pressure systems are also shown. The orange branch line indicates a squall line.
Current usage metrics show cumulative count of Article Views (full-text article views including HTML views, PDF and ePub downloads, according to the available data) and Abstracts Views on Vision4Press platform.
Data correspond to usage on the plateform after 2015. The current usage metrics is available 48-96 hours after online publication and is updated daily on week days.
Initial download of the metrics may take a while.