Figure 4
Download original image
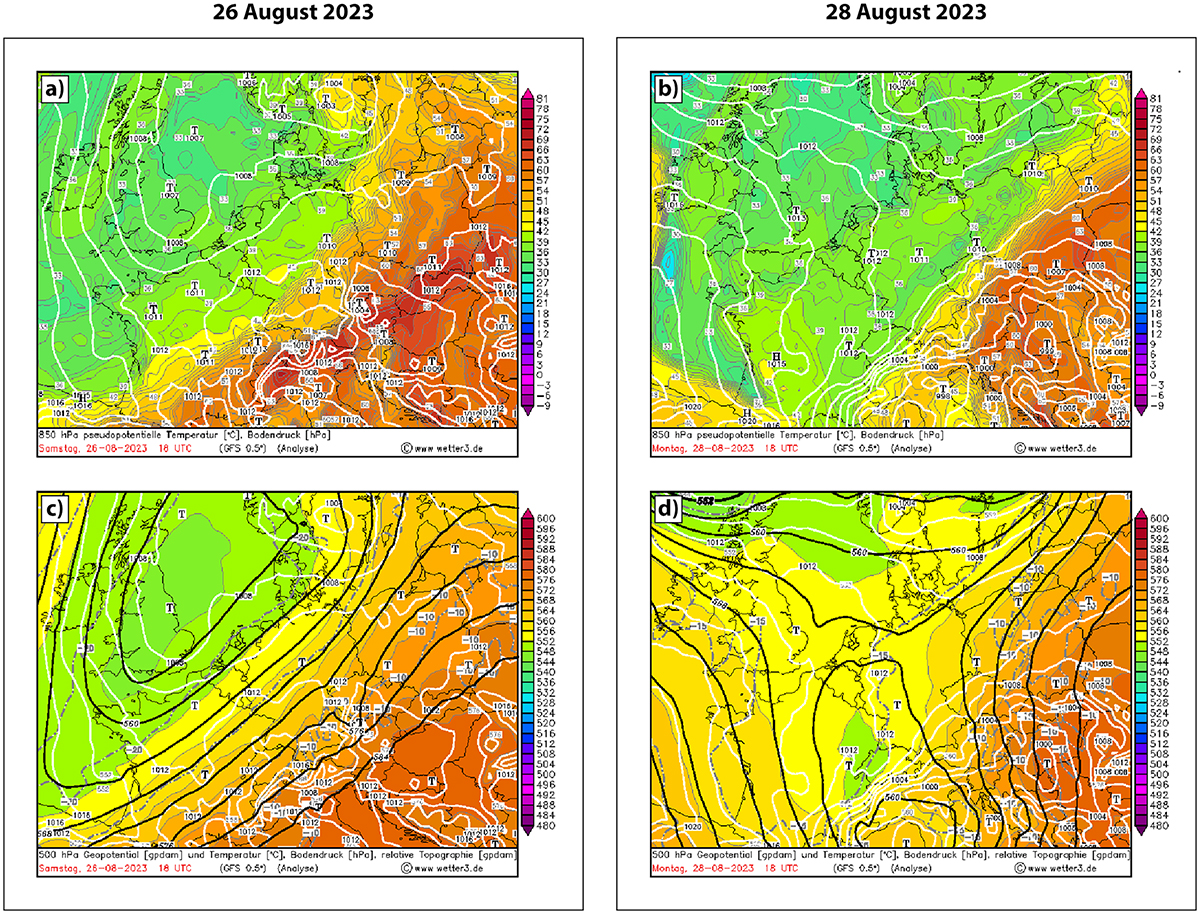
Upper Panels: Pseudo-equivalent potential temperature at the 850 hPa pressure level (colour scale, 3 °C spacing and grey isotherms, 1.5 °C spacing) and surface pressure field (white contours, 2 hPa spacing). The theoretical pseudo-equivalent temperature is higher than the “normal” temperature by the specific heat of the water vapour contained in the air mass. It therefore includes information about both the temperature and the humidity of the air mass. Bottom Panels: Distribution of the geopotential height of the 500 hPa level (black lines, 4 decameter spacing), the temperature at the 500 hPa level (grey dashed lines, 5 °C spacing), the surface pressure field (white lines, 2 hPa spacing) and the relative topography between 500 and 1000 hPa (colour scale, 4 decametres) – represents the vertical distance between the 1000 hPa level (surface) and the 500 hPa level (middle troposphere, about 5.5 km) and varies with temperature and humidity – orange/red values indicate tropical air masses and yellow/green indicate polar air masses. a) and c) on 26 August 2023, 18 UTC; b) and d) on 28 August 2023, 18 UTC. Available at https://www.wetterzentrale.de/de/reanalysis.php?map=1&model=dwd&var=45, accessed on 19 January 2025.
Current usage metrics show cumulative count of Article Views (full-text article views including HTML views, PDF and ePub downloads, according to the available data) and Abstracts Views on Vision4Press platform.
Data correspond to usage on the plateform after 2015. The current usage metrics is available 48-96 hours after online publication and is updated daily on week days.
Initial download of the metrics may take a while.