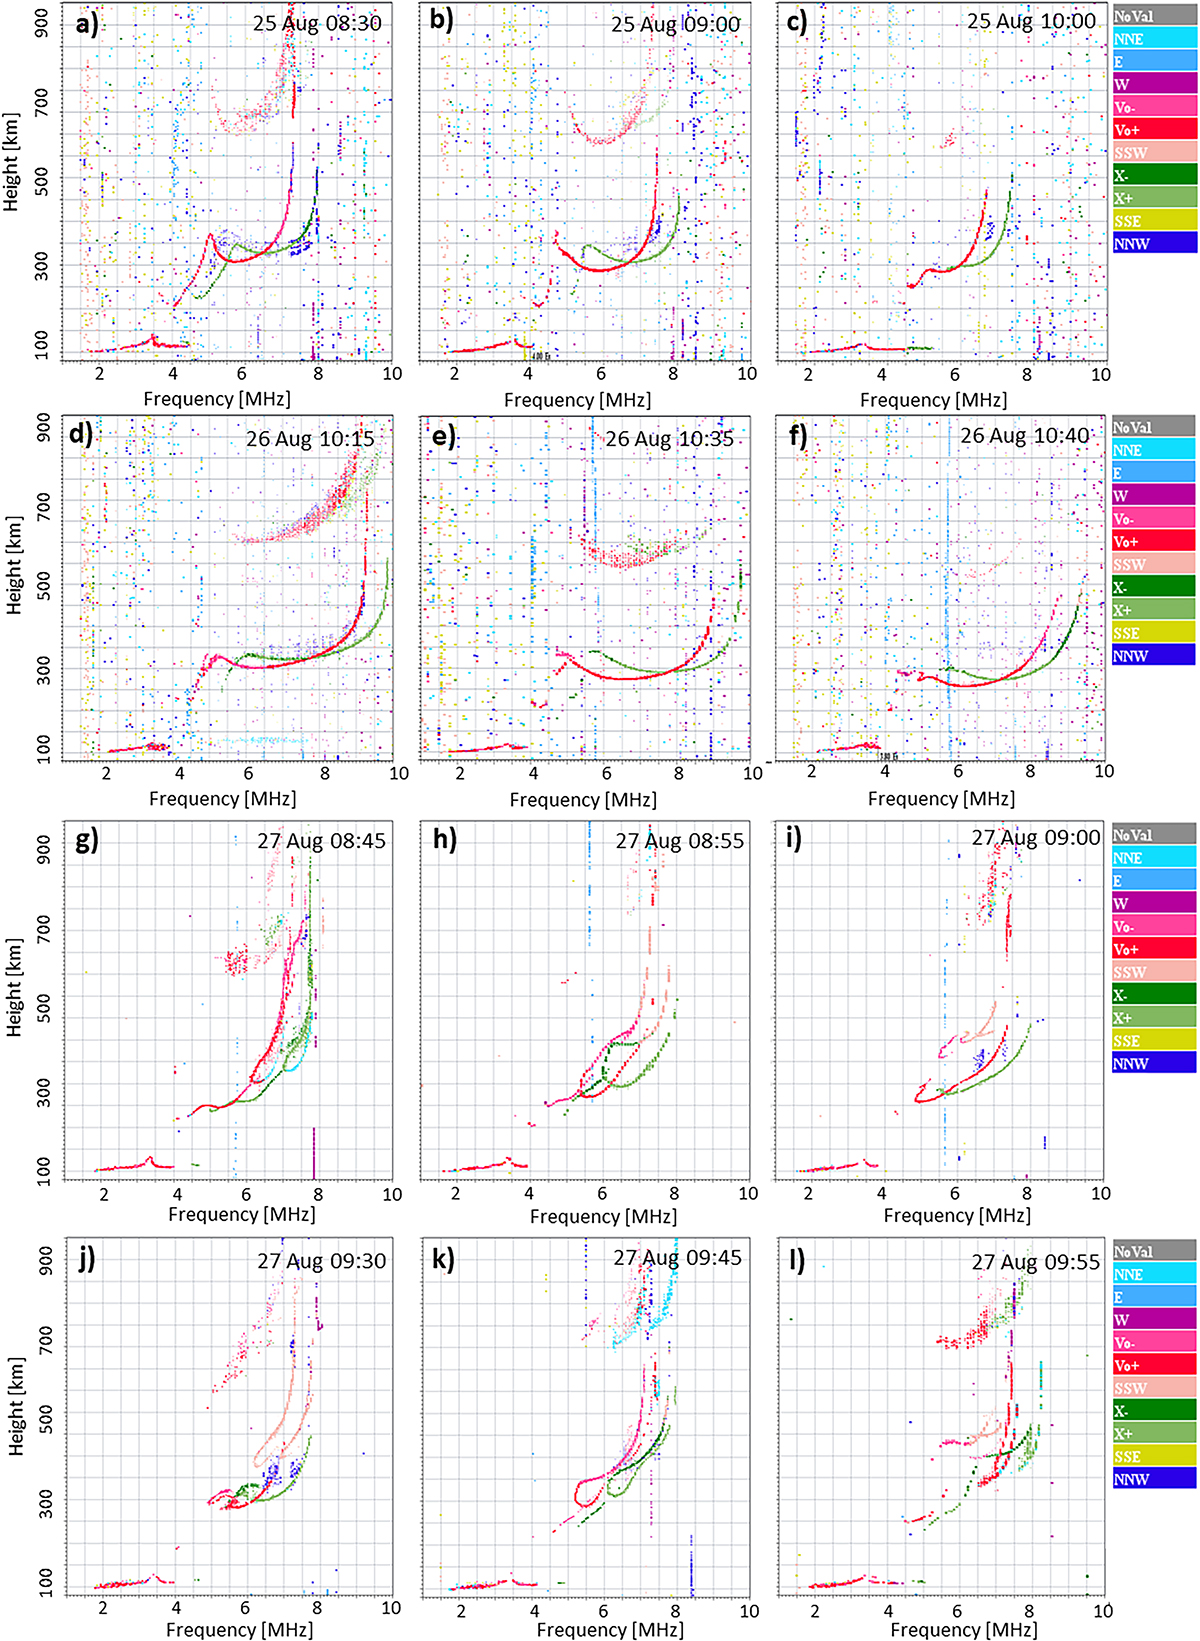
Figure 8
Download original image
Examples of ionograms recorded at Průhonice station during daytime (08–11 UT) on 25 August (a–c), on 26 August (d–f) and on 27 August (g–i). F traces without TID signatures (white in Table 3) are shown in Figures 8a and 8c, while weak TID signatures which affect <0.5 and 0.5 < f < 1.5 MHz frequency range are seen on plots b, d, e and f respectively (pale orange colours in Table 3). Very distorted ionograms (essentially the whole observed F trace is affected) are seen on plots g–i. All times are given in UT.
Current usage metrics show cumulative count of Article Views (full-text article views including HTML views, PDF and ePub downloads, according to the available data) and Abstracts Views on Vision4Press platform.
Data correspond to usage on the plateform after 2015. The current usage metrics is available 48-96 hours after online publication and is updated daily on week days.
Initial download of the metrics may take a while.