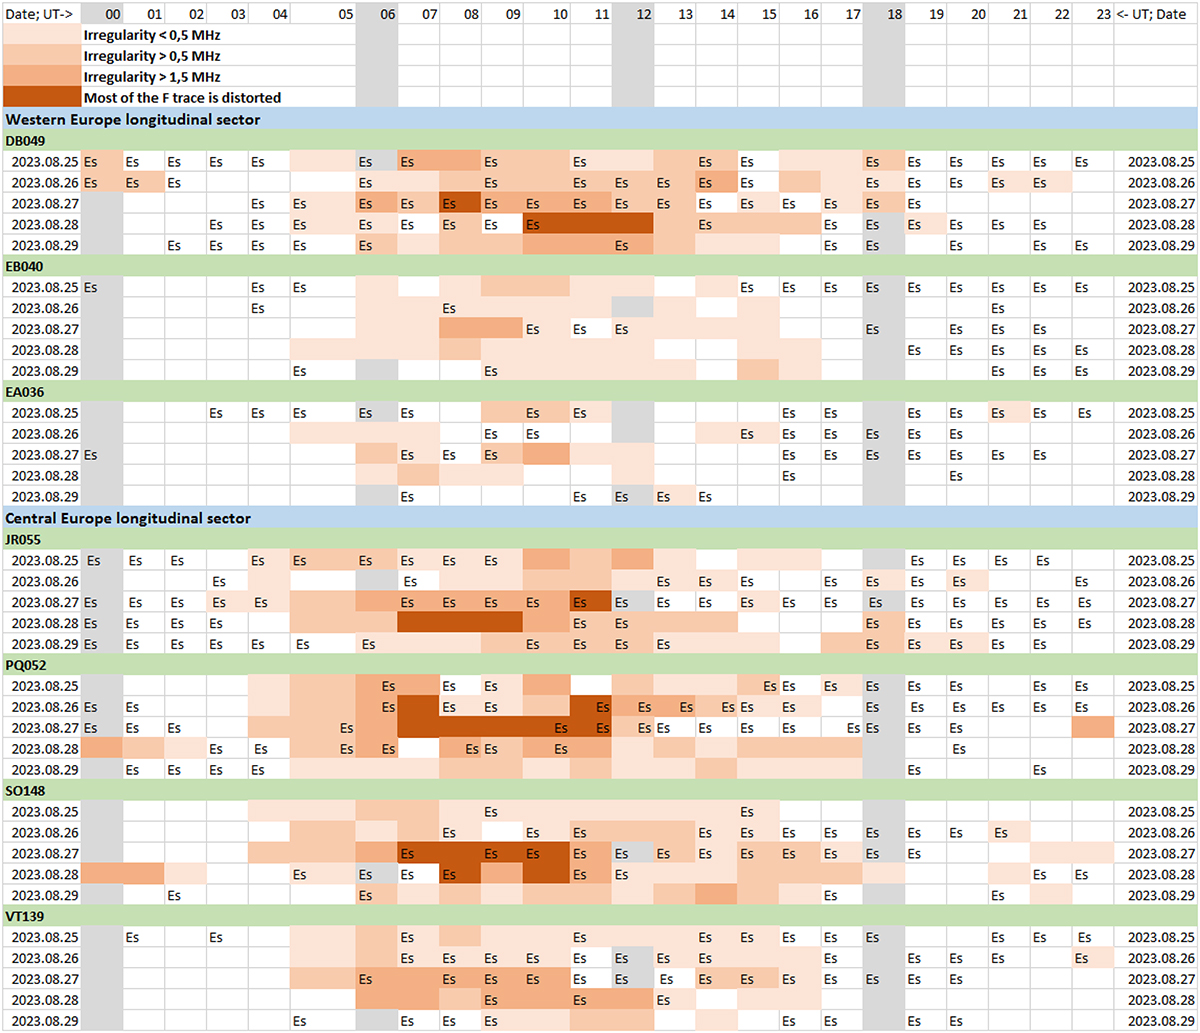
Table 3
Summary of the TID activity observed in the traces of the ionograms at European stations during the front passage between 25 and 29 August 2023 (the dates can be seen in the first column). The columns indicate the hours in UT. The investigated stations are DB049, EB040, EA036 from North to South in the Western Europe longitudinal sector, and JR055, PQ052, SO148, and VT139 from North to South in the Central Europe longitudinal Sector (see Fig. 1). The colours indicate the intensity of the TID activity as seen on the ionograms (if at least two ionograms during that hour were affected). Light orange is used when the affected frequency range is less than 0.5 MHz, while the darkest orange denotes the case if most of the F trace was distorted. The presence of a Sporadic E layer is indicated with the label “Es”.
|
Current usage metrics show cumulative count of Article Views (full-text article views including HTML views, PDF and ePub downloads, according to the available data) and Abstracts Views on Vision4Press platform.
Data correspond to usage on the plateform after 2015. The current usage metrics is available 48-96 hours after online publication and is updated daily on week days.
Initial download of the metrics may take a while.