Figure 2
Download original image
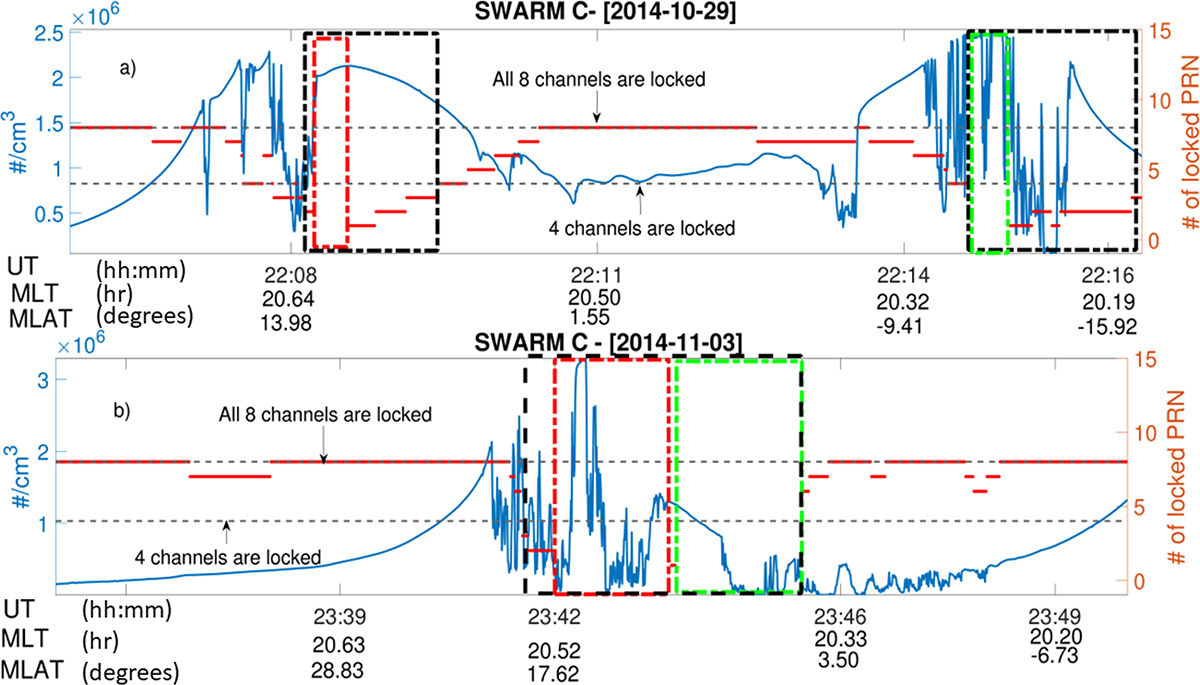
Electron density profile for two LNC events. a) The blue line is the electron density profile measured with the Swarm C LP on October 29, 2014. The red broken line shows the number of GPS satellites the Swarm C GPS receivers can lock onto. The black dashed rectangles are electron density profiles during the LNC events. Red and green dashed rectangles are two total LOL events, during which signals from all satellites were disrupted. Panel b) is an LNC event during the November 3, 2014 event. There is just one LNC instance, including two total LOL events.
Current usage metrics show cumulative count of Article Views (full-text article views including HTML views, PDF and ePub downloads, according to the available data) and Abstracts Views on Vision4Press platform.
Data correspond to usage on the plateform after 2015. The current usage metrics is available 48-96 hours after online publication and is updated daily on week days.
Initial download of the metrics may take a while.