Figure 5
Download original image
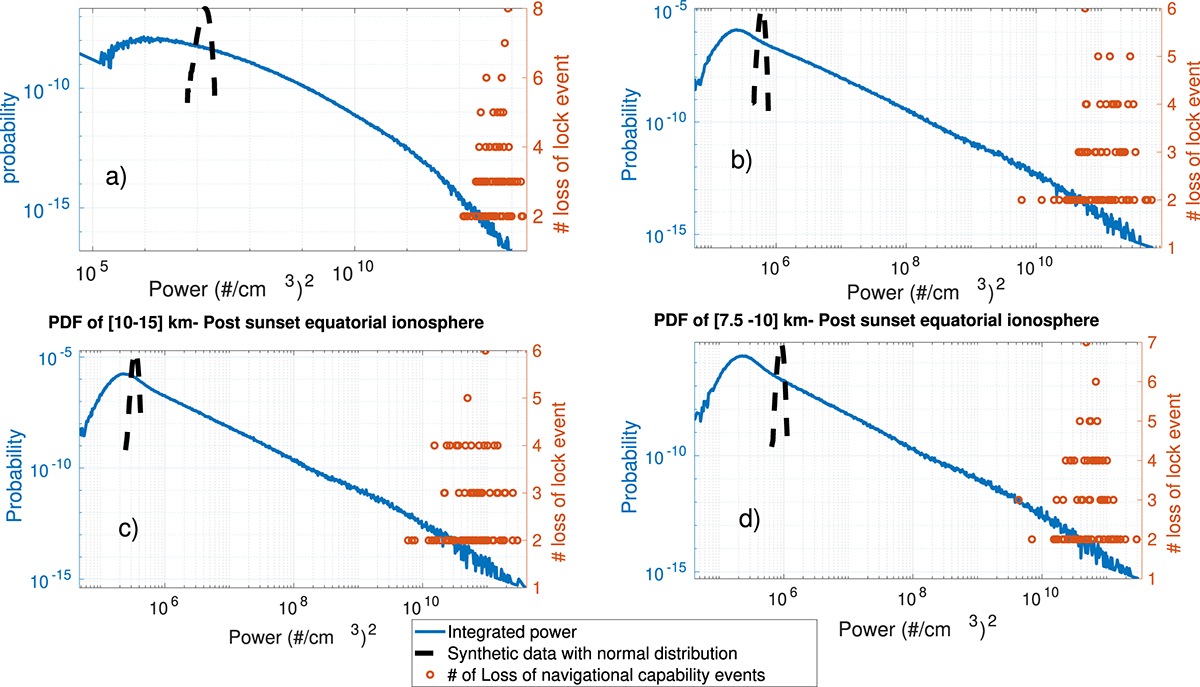
Histogram of integrated power in four frequency bands scale size for Swarm-C over nearly ten years. a) Histogram of integrated power for irregularities with scales in the 30–450 km range in the log-log scale. The red circles indicate the number of LNC instances per bin for individual events. The black line represents synthetic data with a normal distribution. Panels (b–d) for integrated power are similar to panel (a) for fluctuations having scale sizes of 15–30 km, 10–15 km, and 7.5–10 km, respectively.
Current usage metrics show cumulative count of Article Views (full-text article views including HTML views, PDF and ePub downloads, according to the available data) and Abstracts Views on Vision4Press platform.
Data correspond to usage on the plateform after 2015. The current usage metrics is available 48-96 hours after online publication and is updated daily on week days.
Initial download of the metrics may take a while.