Figure 7
Download original image
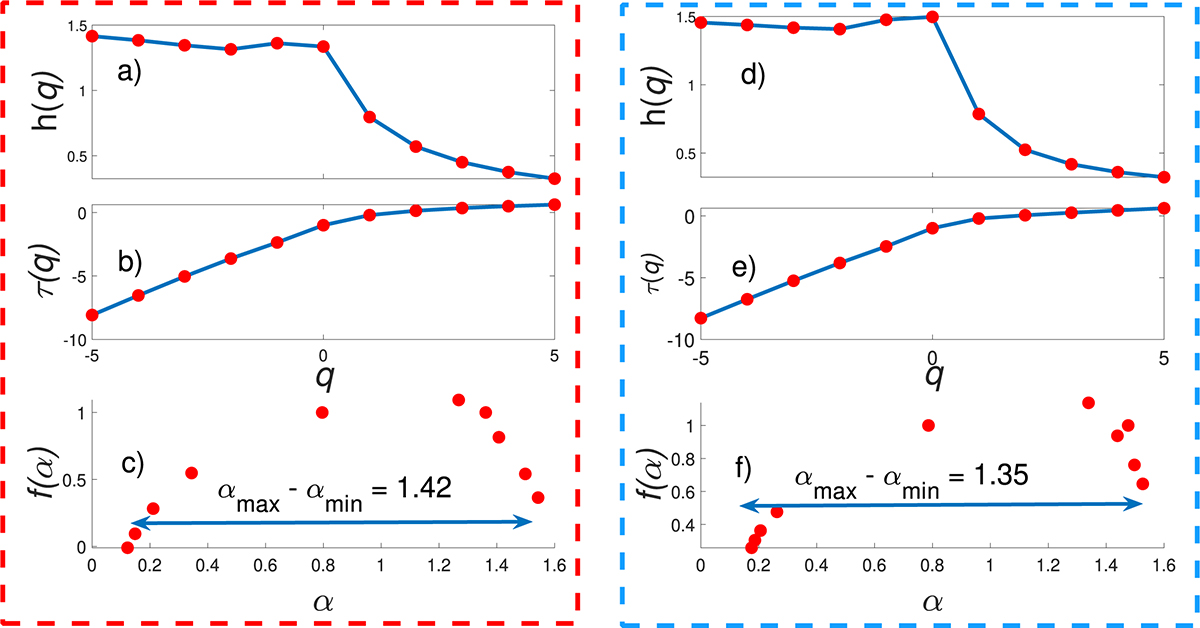
Exponents of multifractal detrended fluctuation analysis for the third band of integrated power in 2014 and 2017. a) Generalized q-order Hurst exponents h(q) for q = −5 to q = 5 for density fluctuation power in 2014. b) Mass exponent τ(q) for q orders similar to a). c) The graphical representation of singularity exponent α versus singularity dimension f(α) recognized as the multifractal spectrum. The arrow represents the difference between α’s maximum and minimum. Panels d) to f) are comparable to panels a) to c) for the same integrated power band in 2017.
Current usage metrics show cumulative count of Article Views (full-text article views including HTML views, PDF and ePub downloads, according to the available data) and Abstracts Views on Vision4Press platform.
Data correspond to usage on the plateform after 2015. The current usage metrics is available 48-96 hours after online publication and is updated daily on week days.
Initial download of the metrics may take a while.