Figure 8
Download original image
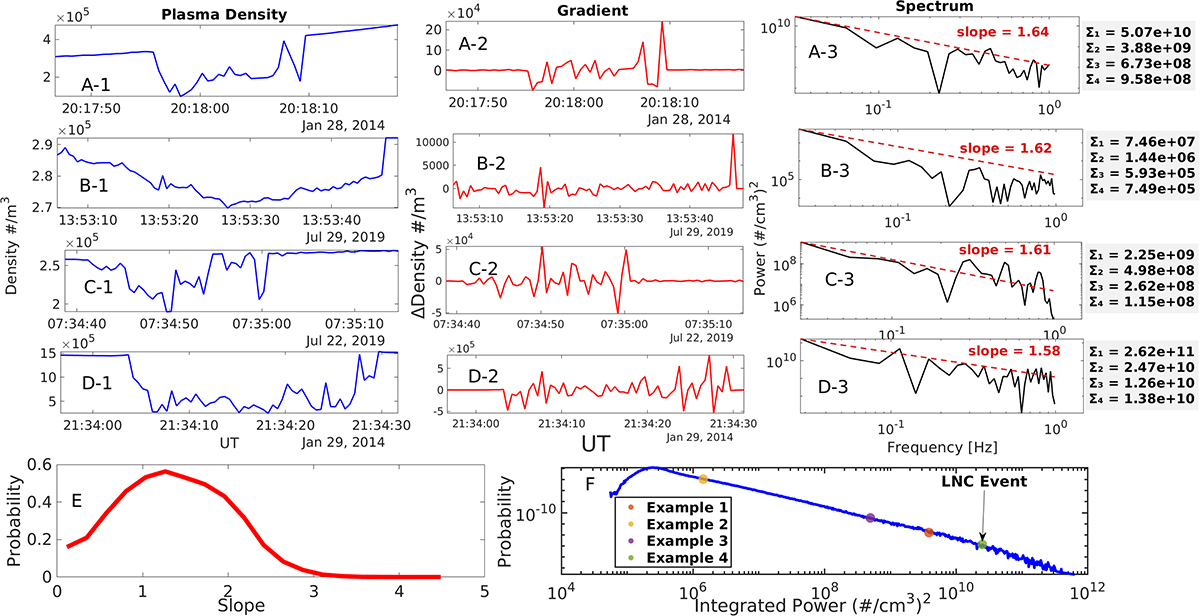
Representative ionospheric examples and their statistical characteristics. Each row corresponds to a distinct electron density irregularity example. Column 1: Time series of electron density fluctuations measured by the Swarm-C satellite. Column 2: Corresponding density gradients (ROD). Column 3: Power spectral densities of each event, with fitted slopes around 1.6. Panel E: Histogram of spectral slopes computed from nearly 10 years of data. Panel F: Probability distribution of integrated power of plasma density in the second frequency band, compiled from the 10-year dataset. Colored circles indicate the location of the four representative events.
Current usage metrics show cumulative count of Article Views (full-text article views including HTML views, PDF and ePub downloads, according to the available data) and Abstracts Views on Vision4Press platform.
Data correspond to usage on the plateform after 2015. The current usage metrics is available 48-96 hours after online publication and is updated daily on week days.
Initial download of the metrics may take a while.