Open Access
Figure 1
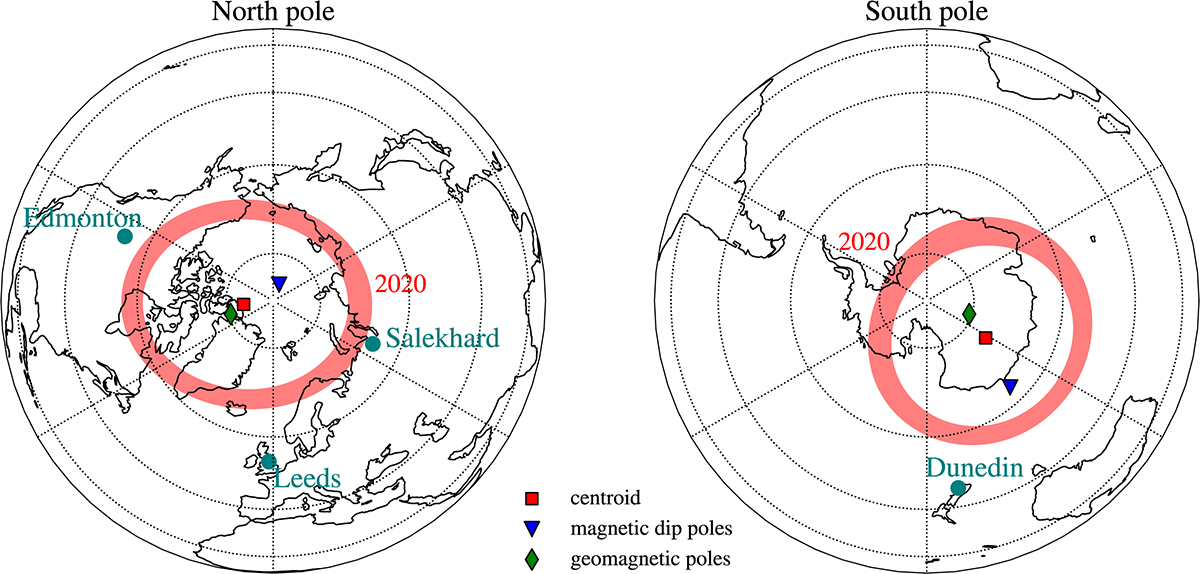
Download original image
Auroral zones for the year 2020 AD, indicated by the shaded areas. Also indicated are the locations of the geomagnetic poles (diamonds), the dip poles (triangles), and polar cap centroids (squares). Also reported by the figure are the locations of four high-latitude cities considered in this study.
Current usage metrics show cumulative count of Article Views (full-text article views including HTML views, PDF and ePub downloads, according to the available data) and Abstracts Views on Vision4Press platform.
Data correspond to usage on the plateform after 2015. The current usage metrics is available 48-96 hours after online publication and is updated daily on week days.
Initial download of the metrics may take a while.