Figure 10
Download original image
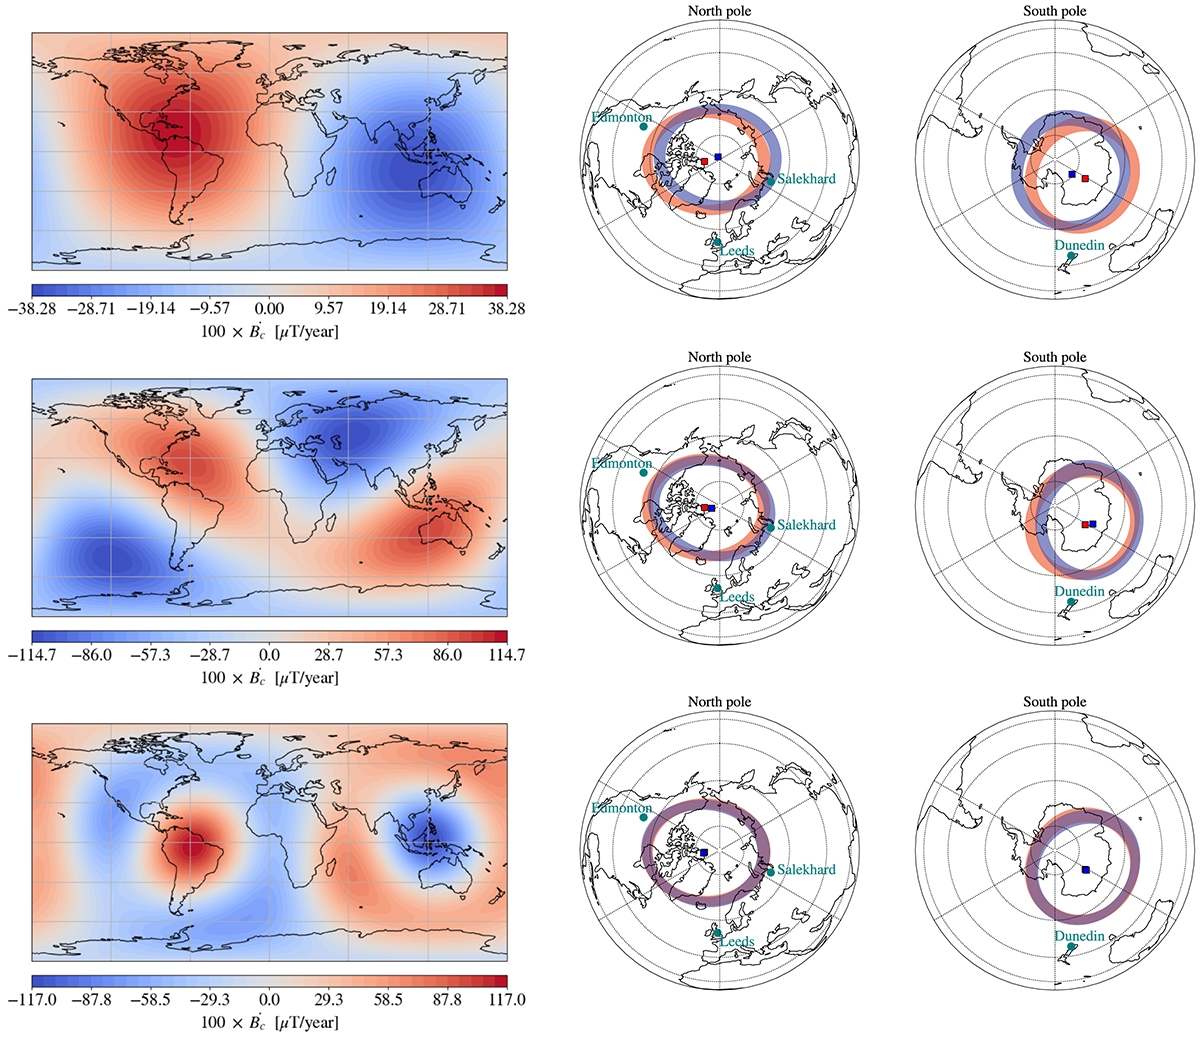
Effect of l = 1, 2, 3 components (respectively top, middle, and bottom panels) of the SV on the shape and position of the auroral zones. For illustrative purposes, the actual SV has been magnified by a factor of 100. Left panels: the magnified SV components at the CMB. Middle and right panels: the northern and auroral zones, plotted with the centroid positions for the 2020 IGRF-13 model (red) and the same model, on top of which the SV shown in the left panels is added (blue).
Current usage metrics show cumulative count of Article Views (full-text article views including HTML views, PDF and ePub downloads, according to the available data) and Abstracts Views on Vision4Press platform.
Data correspond to usage on the plateform after 2015. The current usage metrics is available 48-96 hours after online publication and is updated daily on week days.
Initial download of the metrics may take a while.