Open Access
Figure 9
Download original image
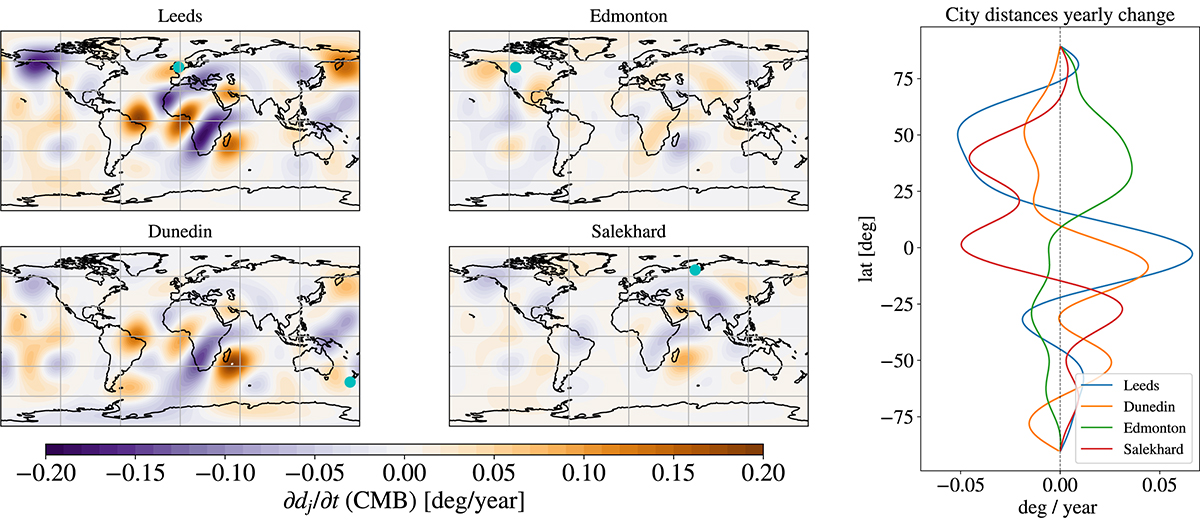
CMB sources of temporal changes in the auroral zone angular distance from selected cities, during the period 2015–2020 AD. The rightmost panel illustrates the azimuthally integrated contribution (Eq. (17)). The selected locations are shown on the maps as cyan dots.
Current usage metrics show cumulative count of Article Views (full-text article views including HTML views, PDF and ePub downloads, according to the available data) and Abstracts Views on Vision4Press platform.
Data correspond to usage on the plateform after 2015. The current usage metrics is available 48-96 hours after online publication and is updated daily on week days.
Initial download of the metrics may take a while.