Figure 7
Download original image
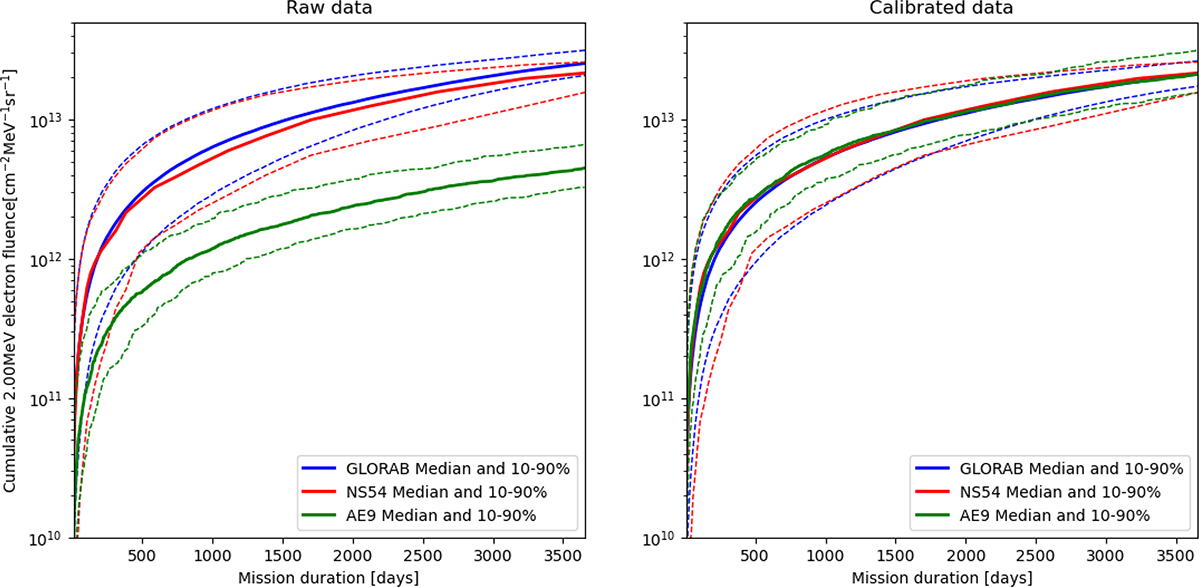
Cumulative fluences along the NS54 mission. The left panel shows the raw datasets (our model in blue, NS54/CXD2R data in red, AE9 in green). The right panel shows the same fluence with both models calibrated to have the same median long-term average as the observation data. In each plot, the thick solid lines present the median values and the dashed lines present the 10th and 90th percentiles.
Current usage metrics show cumulative count of Article Views (full-text article views including HTML views, PDF and ePub downloads, according to the available data) and Abstracts Views on Vision4Press platform.
Data correspond to usage on the plateform after 2015. The current usage metrics is available 48-96 hours after online publication and is updated daily on week days.
Initial download of the metrics may take a while.