Figure 10
Download original image
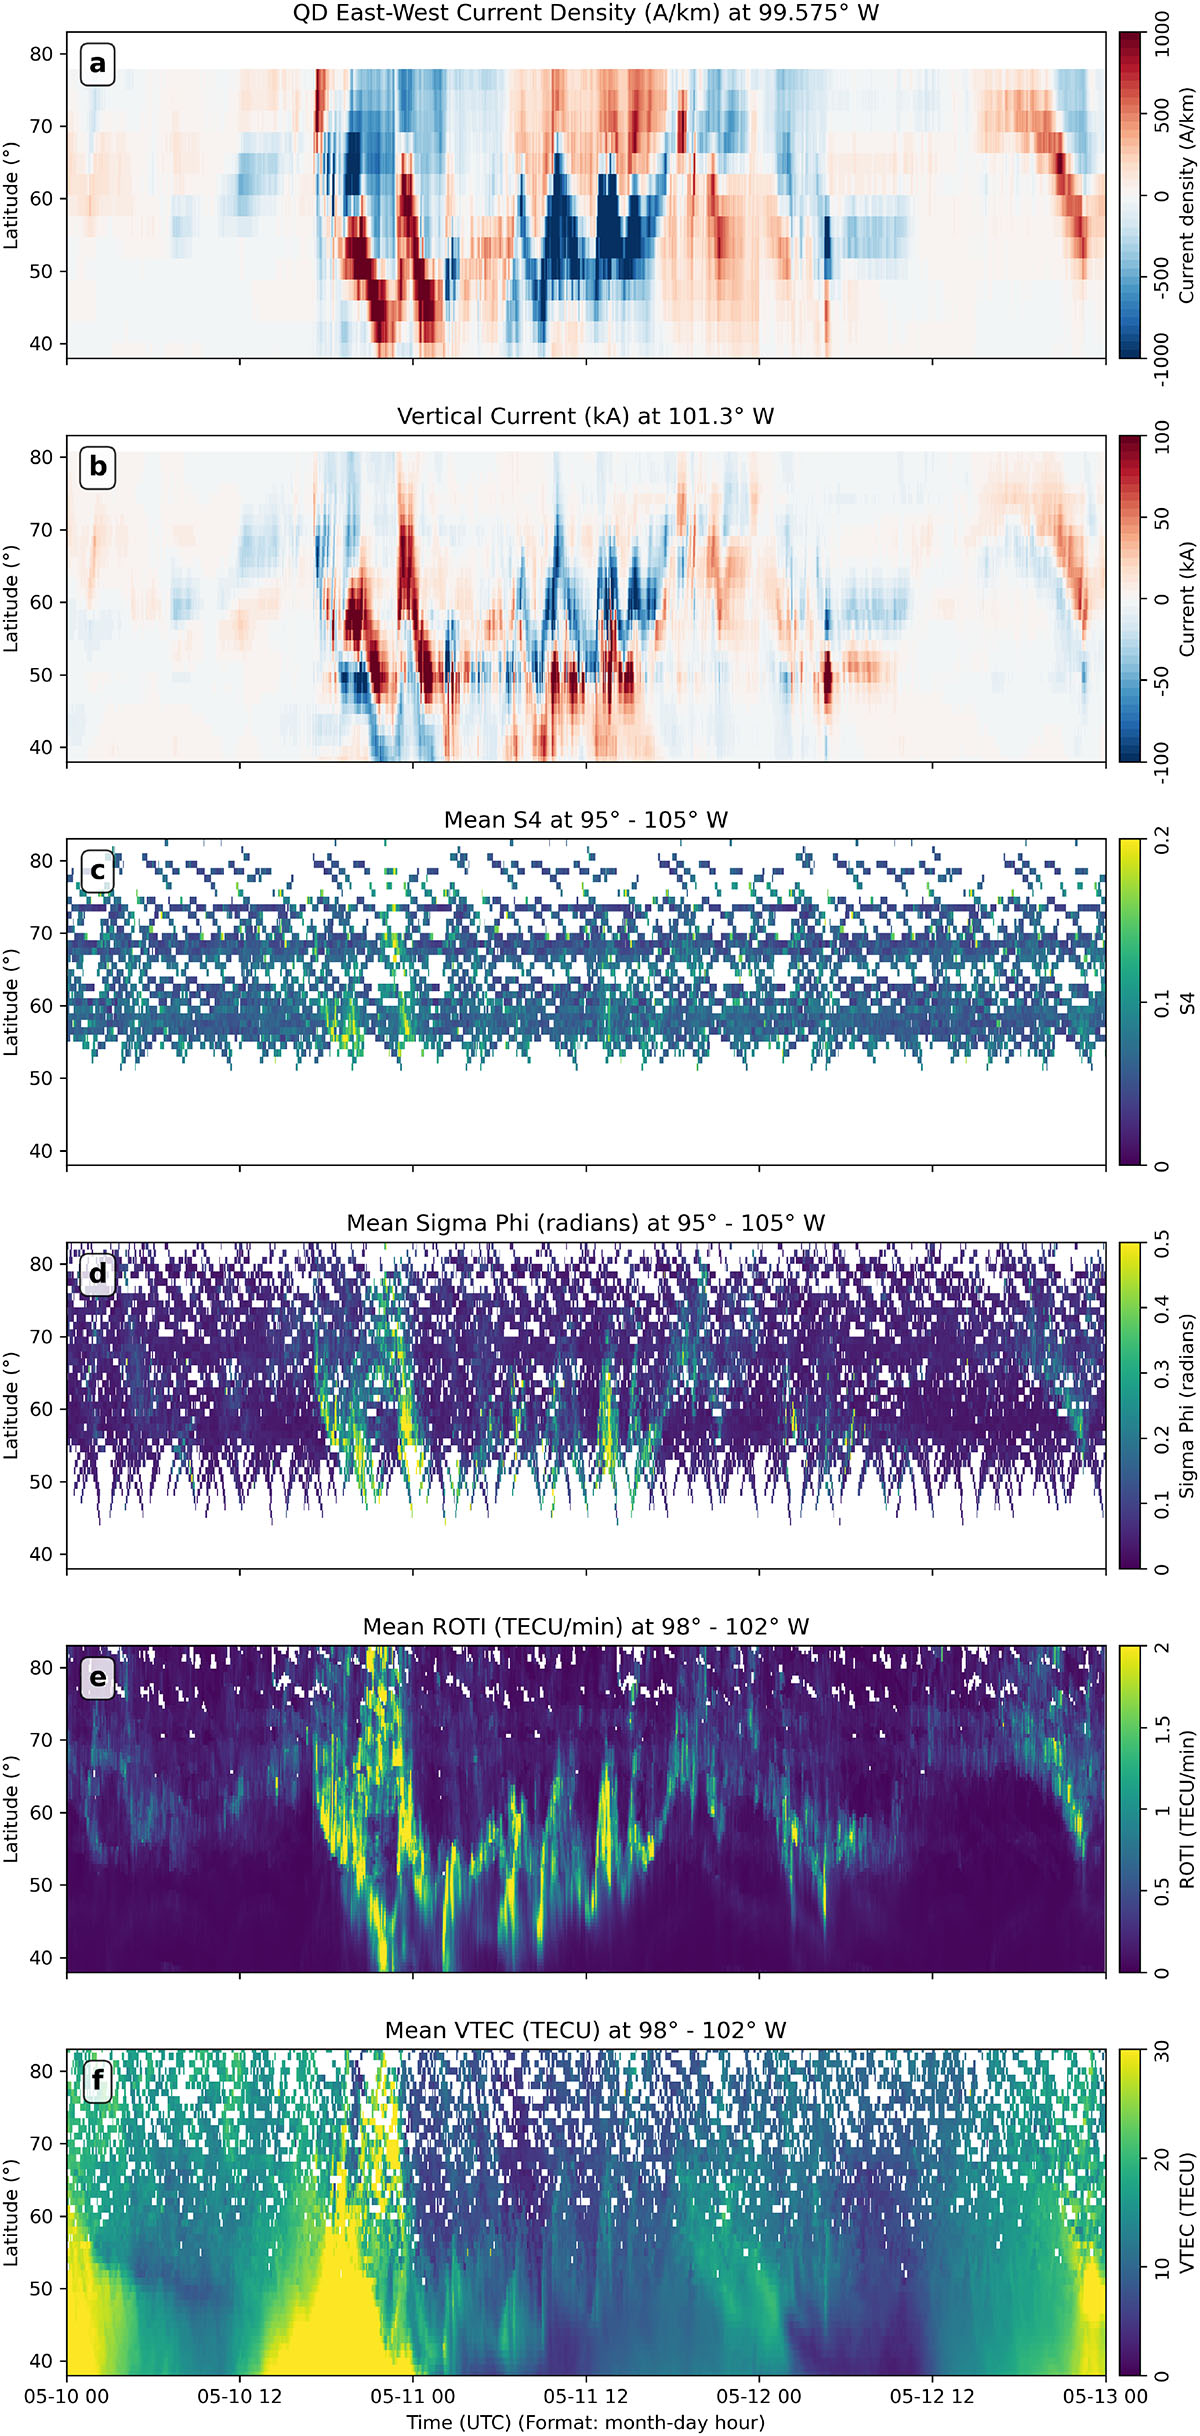
a) QD east-west (red-blue) current density keogram at 99.575° W. b) Vertical (red is downward) current keogram at 101.3° W. c) Amplitude scintillation index keogram for the mean value in the longitude interval of 95–105° W. d) Phase scintillation index keogram for the mean value in the longitude interval of 95–105° W. e) ROTI (30 s) keogram for the mean value in the longitude interval of 98–102° W. f) VTEC keogram for the mean value in the longitude interval of 98–102° W.
Current usage metrics show cumulative count of Article Views (full-text article views including HTML views, PDF and ePub downloads, according to the available data) and Abstracts Views on Vision4Press platform.
Data correspond to usage on the plateform after 2015. The current usage metrics is available 48-96 hours after online publication and is updated daily on week days.
Initial download of the metrics may take a while.