Figure 11
Download original image
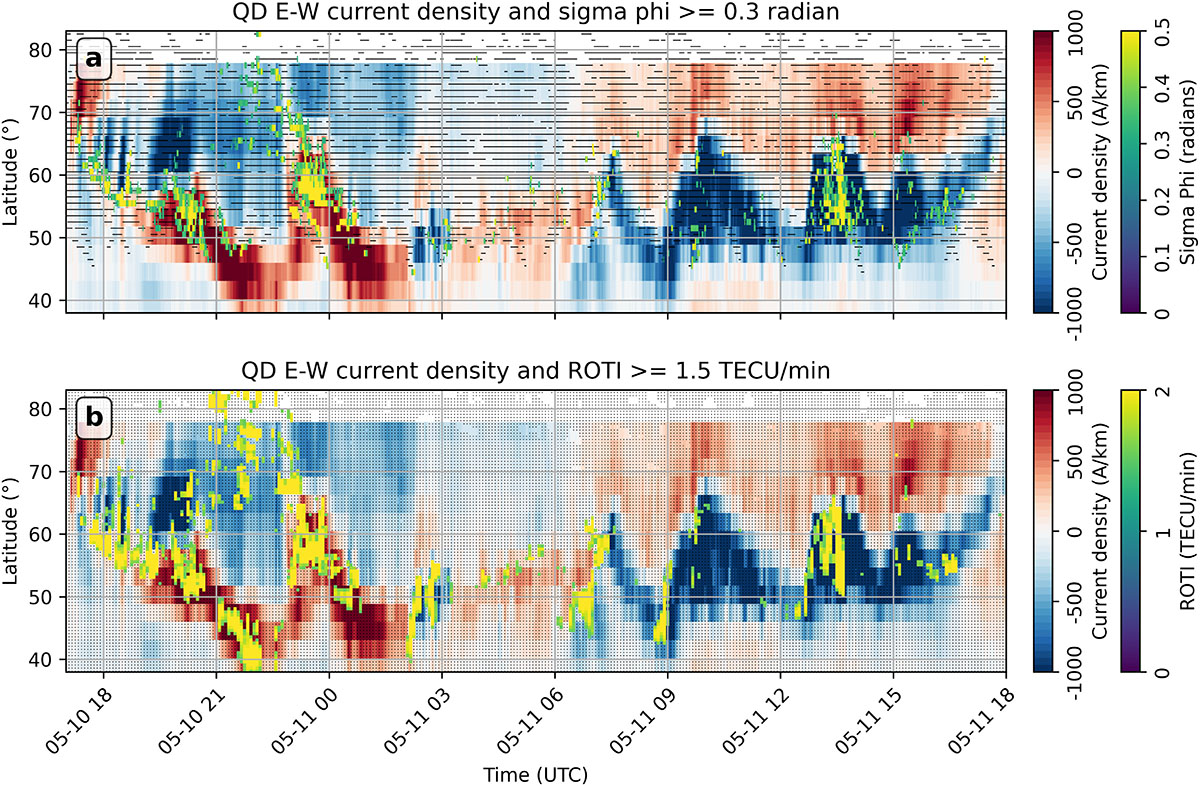
A zoomed-in view of panel (a) of Figure 10, with a) a filtered version of phase scintillation plotted on top, showing only values ≥ 0.3 radians. b) A filtered version of ROTI (30 s) plotted on top, showing only values ≥ 1.5 TECU/min. Small black dots are plotted when there is data coverage of σϕ/ROTI but with values below the thresholds.
Current usage metrics show cumulative count of Article Views (full-text article views including HTML views, PDF and ePub downloads, according to the available data) and Abstracts Views on Vision4Press platform.
Data correspond to usage on the plateform after 2015. The current usage metrics is available 48-96 hours after online publication and is updated daily on week days.
Initial download of the metrics may take a while.