Figure 16
Download original image
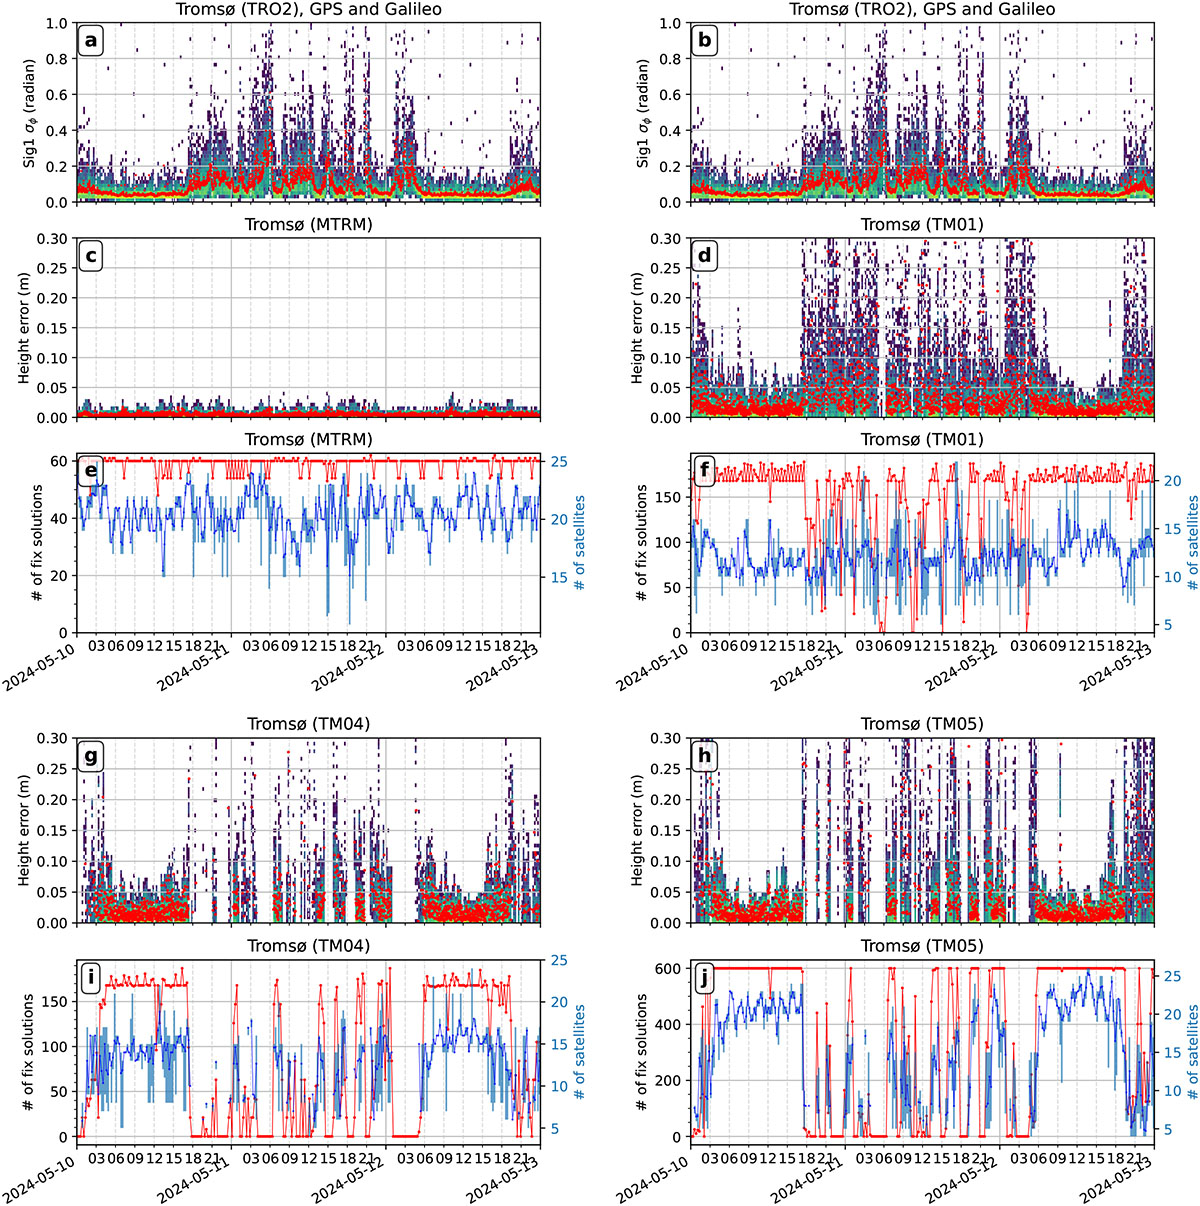
a, b: Phase scintillation observed at TRO2. The red line shows the mean value, while the colored background is a heatmap of the values. c, d: Error in the vertical coordinate, for MTRM (c) and TM01 (d). e, f: Number of fix solutions (red line) and number of satellites used for position calculation (blue line), for MTRM (e) and TM01 (f). Note that the normal level for the fix solution parameter is different for different receivers (more details in the text). g, h: Error in the vertical coordinate, for TM04 (g) and TM05 (h). i, j: Number of fix solutions (red line) and number of satellites used for position calculation (blue line), for TM04 (i) and TM05 (j).
Current usage metrics show cumulative count of Article Views (full-text article views including HTML views, PDF and ePub downloads, according to the available data) and Abstracts Views on Vision4Press platform.
Data correspond to usage on the plateform after 2015. The current usage metrics is available 48-96 hours after online publication and is updated daily on week days.
Initial download of the metrics may take a while.