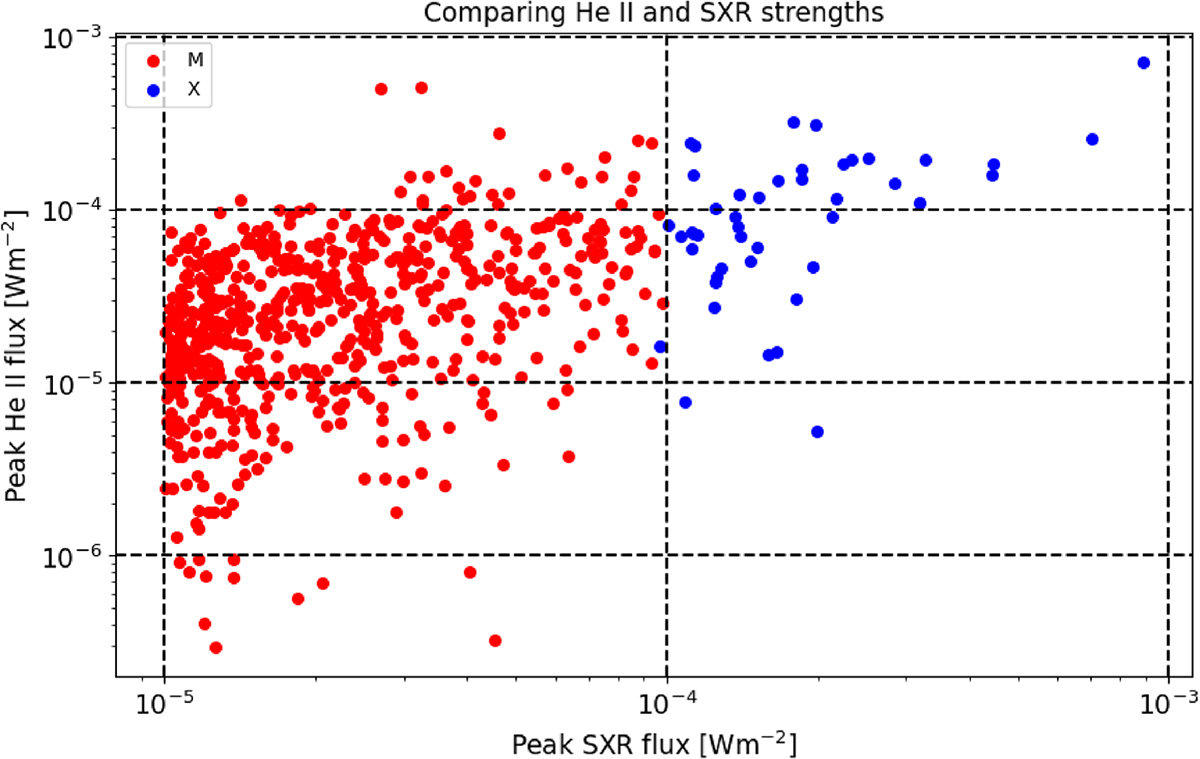
Figure 4.
Download original image
Scatter plot comparing the peak of background-subtracted He II flux and SXR intensities for Type I flares. The He II and SXR values span multiple orders of magnitude, highlighting the relationship between chromospheric and coronal energy release during flare events. This plot is similar to the one in Milligan et al. (2020) for Lyman-alpha.
Current usage metrics show cumulative count of Article Views (full-text article views including HTML views, PDF and ePub downloads, according to the available data) and Abstracts Views on Vision4Press platform.
Data correspond to usage on the plateform after 2015. The current usage metrics is available 48-96 hours after online publication and is updated daily on week days.
Initial download of the metrics may take a while.