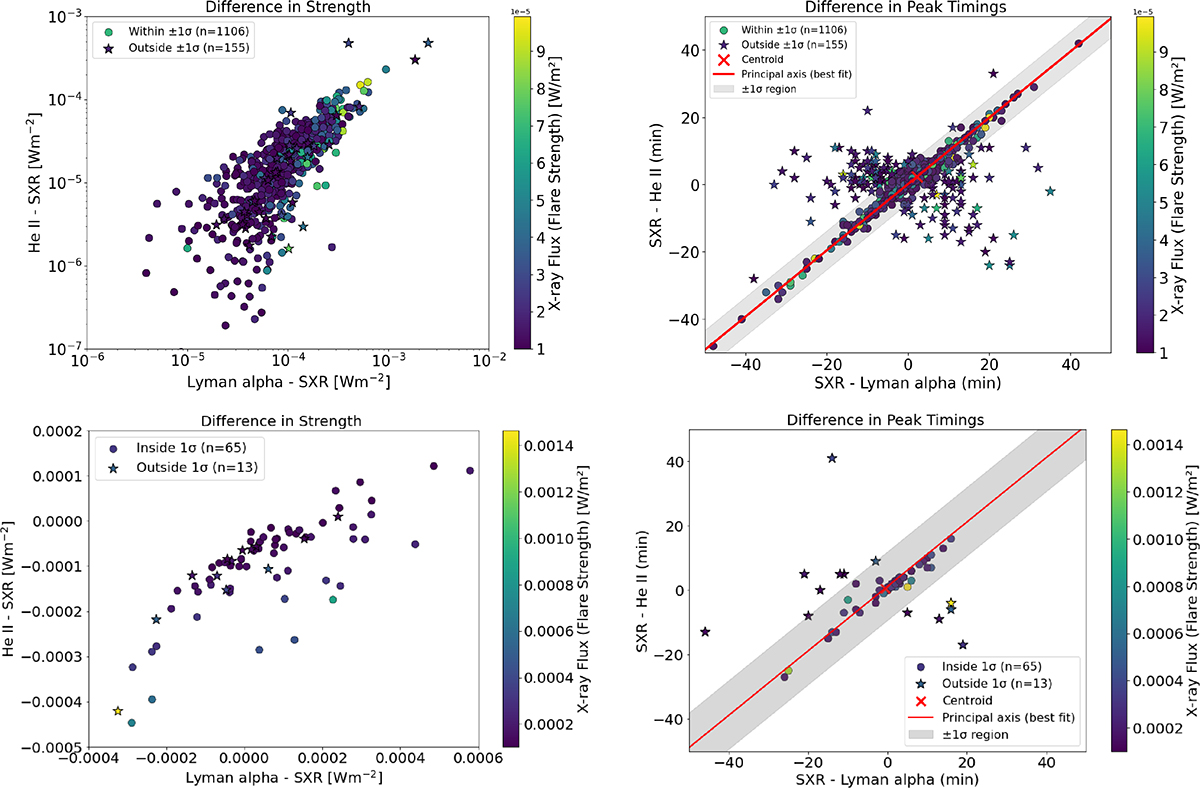
Figure 5.
Download original image
(Left) The difference in flux between the spectral lines illustrates whether they behave similarly in terms of intensity with respect to SXR. (Right) The difference in peak times shows whether Lyman-alpha and He II exhibit similar timing relative to the SXR emission. The top panels correspond to M-class flares, and the bottom panels to X-class flares. The red and blue dots represent flares where Lyman-alpha and He II belong to the same flare Type, while the black dots indicate flares that do not share the same classification across all EUV lines.
Current usage metrics show cumulative count of Article Views (full-text article views including HTML views, PDF and ePub downloads, according to the available data) and Abstracts Views on Vision4Press platform.
Data correspond to usage on the plateform after 2015. The current usage metrics is available 48-96 hours after online publication and is updated daily on week days.
Initial download of the metrics may take a while.