Open Access
Figure 2
Download original image
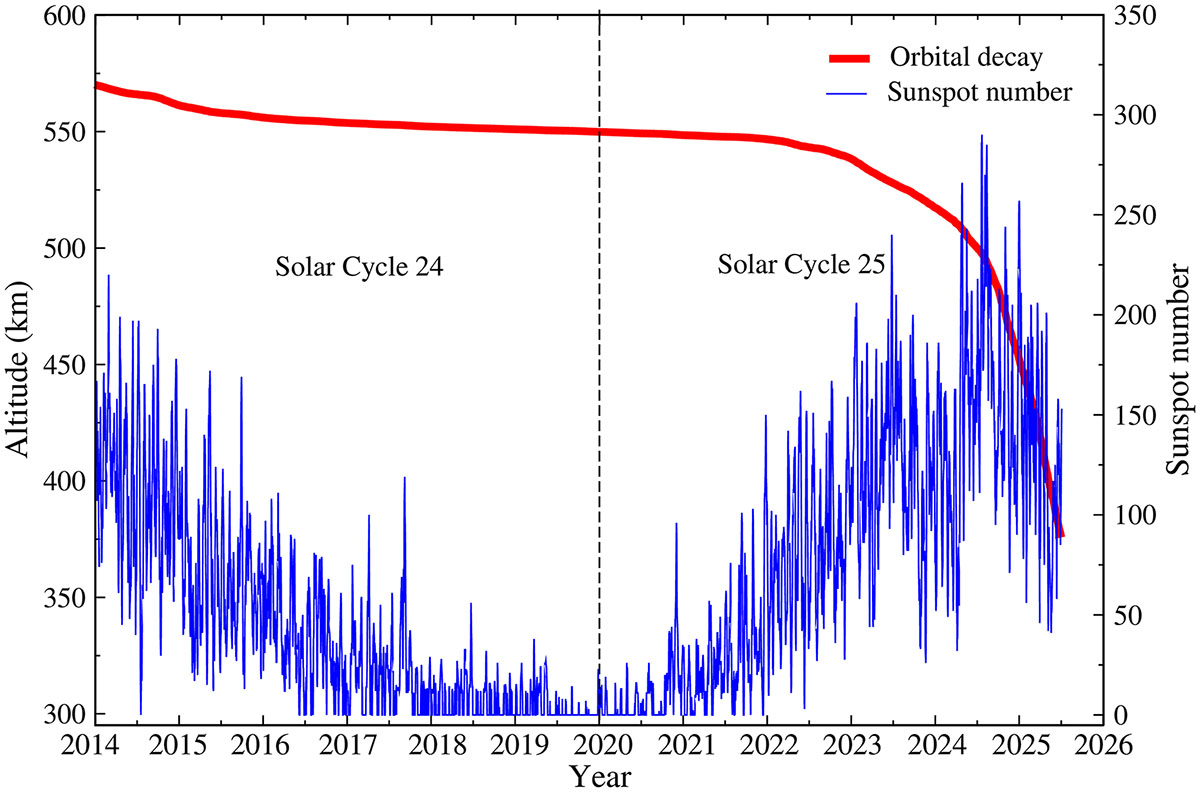
Orbital decay of SATi in relation to solar activity from January 2014 to June 2024. The red curve shows satellite altitude variation, while the blue curve represents the sunspot number (SSN). The transition between Solar cycles 24 and 25 is indicated btythe dashed vertical line.
Current usage metrics show cumulative count of Article Views (full-text article views including HTML views, PDF and ePub downloads, according to the available data) and Abstracts Views on Vision4Press platform.
Data correspond to usage on the plateform after 2015. The current usage metrics is available 48-96 hours after online publication and is updated daily on week days.
Initial download of the metrics may take a while.