Figure 4
Download original image
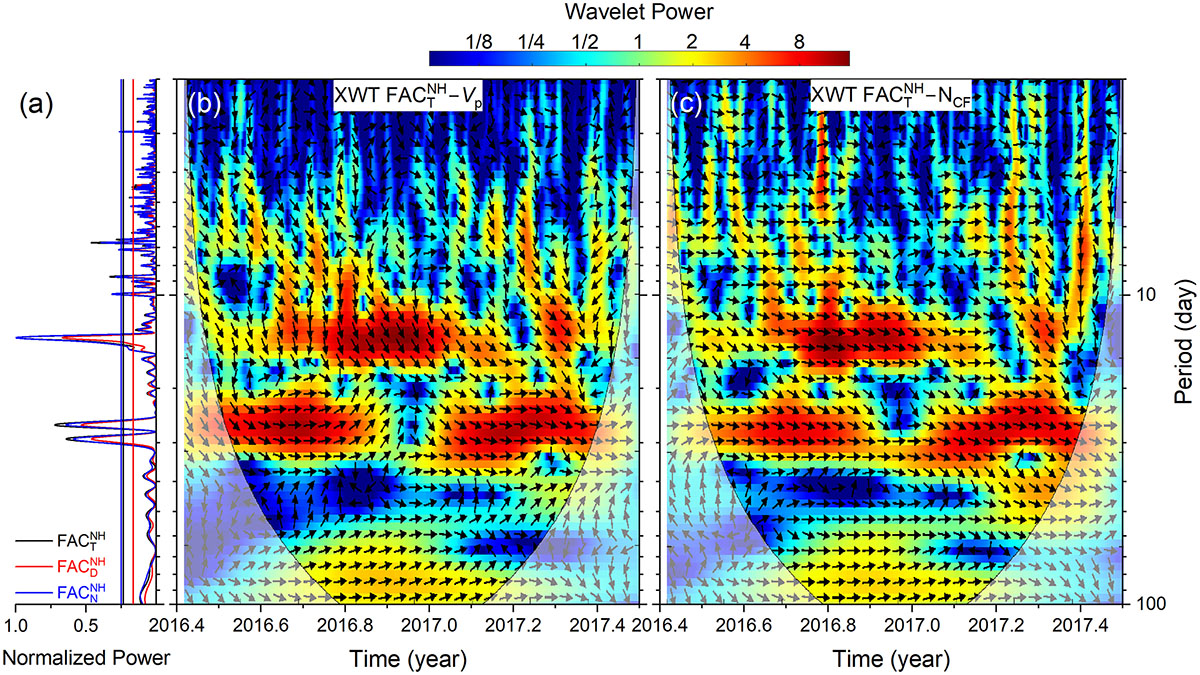
Periodogram analyses of FAC intensity and solar wind coupling. (a) Lomb-Scargle periodograms of the northern hemispheric total (black), dayside (red), and nightside (blue) FAC intensities; T represents total, D is dayside, N is nightside, NH is the northern hemisphere; and 95% confidence levels of the three periodograms are shown by three vertical lines. Cross-wavelet transforms of (b) northern hemispheric total FAC intensity and Vp, and (c) northern hemispheric total FAC intensity and NCF. Wavelet powers are shown by the color bar at the top. The cone of influence, where edge effects might distort the results, is shown in lighter shades. The relative phase relationships (of FAC intensity with Vp and NCF) are shown as arrows, horizontal right arrows indicating in-phase, horizontal left arrows indicating anti-phase. For the Lomb-Scargle periodograms, 2-min resolution FAC intensities are used, while for cross-wavelets, all data are processed into 30-min resolution (by taking 30-min running averages) so that they precisely coincide (in time) with each other.
Current usage metrics show cumulative count of Article Views (full-text article views including HTML views, PDF and ePub downloads, according to the available data) and Abstracts Views on Vision4Press platform.
Data correspond to usage on the plateform after 2015. The current usage metrics is available 48-96 hours after online publication and is updated daily on week days.
Initial download of the metrics may take a while.