Figure 5
Download original image
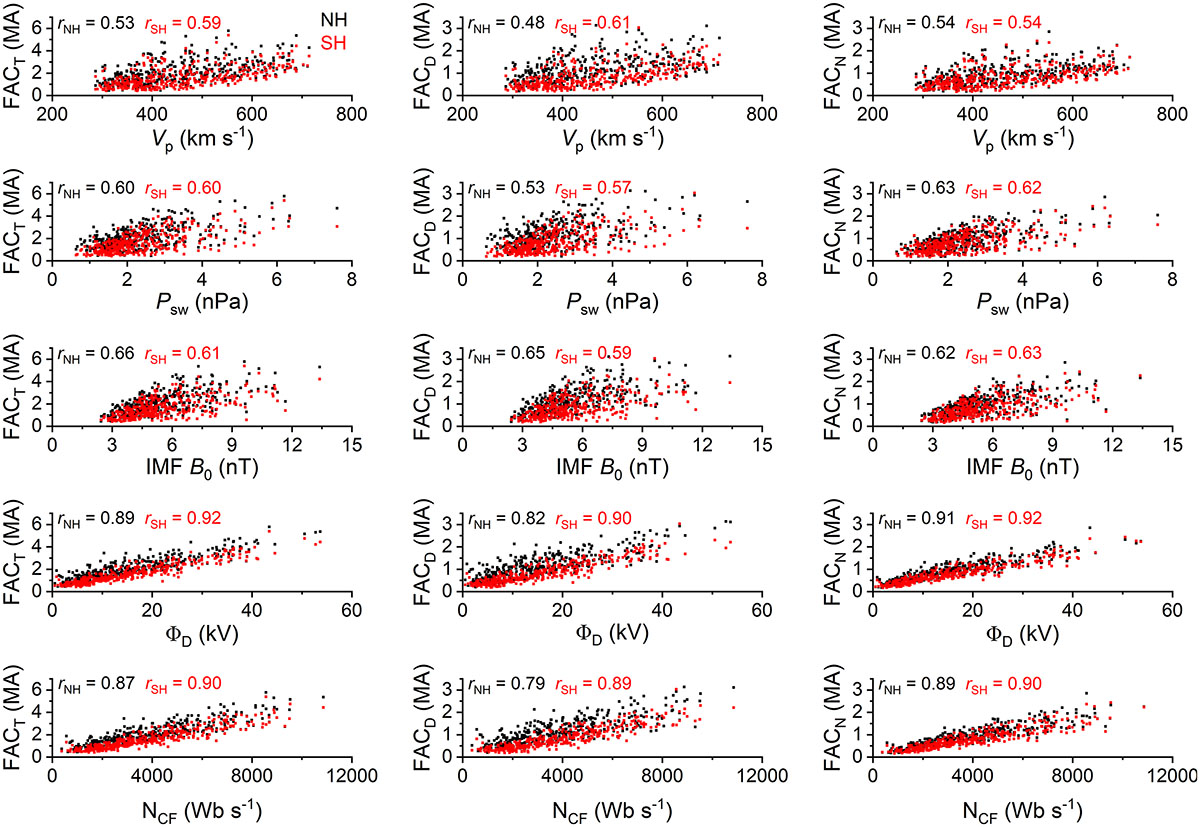
Variations of FAC intensities FACT (left column), FACD (middle column), and FACN (right column) with solar wind plasma, IMF, and solar wind-magnetosphere coupling functions Vp, Psw, IMF B0, ΦD, and NCF (from top to bottom panels). In each panel, black and red data correspond to the northern (NH) and southern (SH) hemispheric FACs, respectively. Pearson’s linear correlation coefficients (r) obtained from linear regression analyses are mentioned in each panel. The statistical significance of the correlation coefficients is confirmed by the Student’s t-test (Student. 1908).
Current usage metrics show cumulative count of Article Views (full-text article views including HTML views, PDF and ePub downloads, according to the available data) and Abstracts Views on Vision4Press platform.
Data correspond to usage on the plateform after 2015. The current usage metrics is available 48-96 hours after online publication and is updated daily on week days.
Initial download of the metrics may take a while.