Figure B1.
Download original image
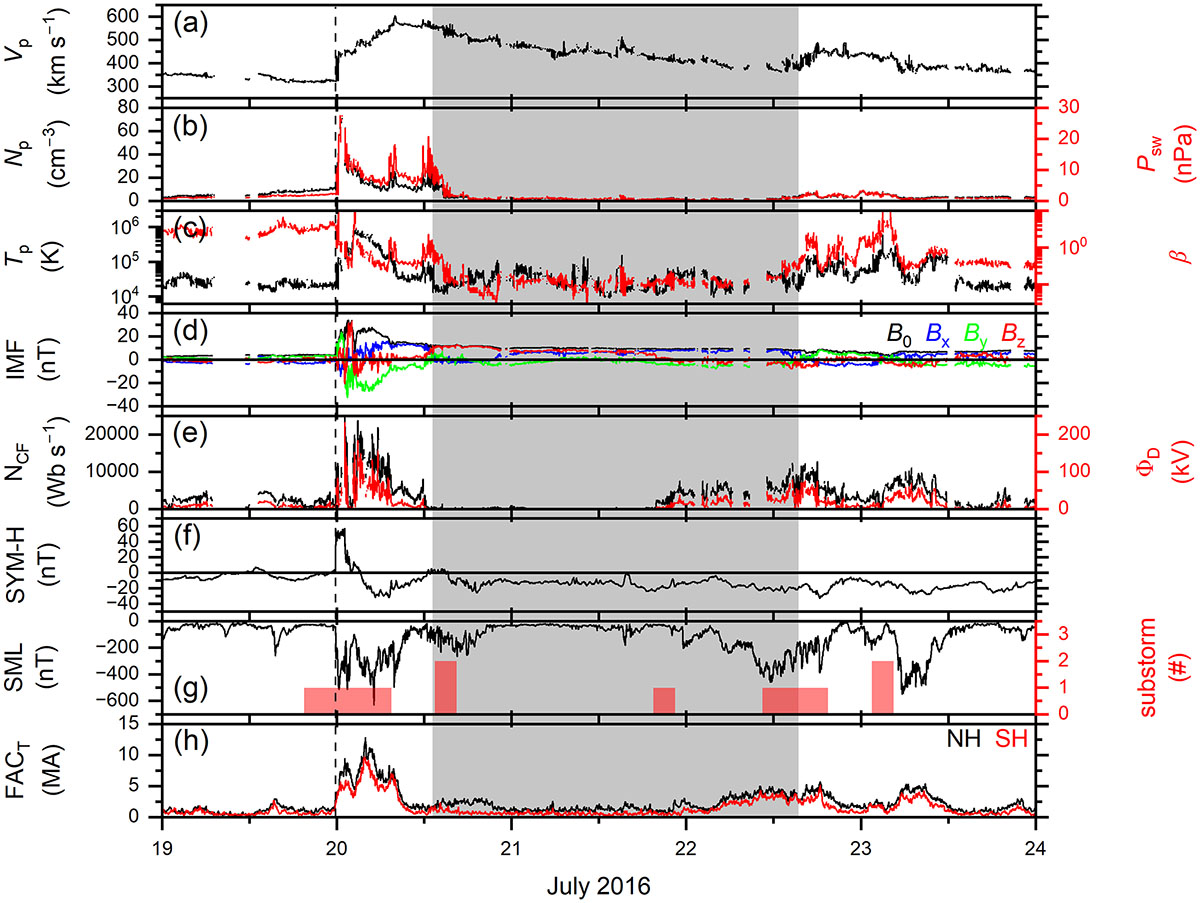
Solar wind, geomagnetic conditions, and FACs associated with an ICME during 19–23 July 2016. From top to bottom, the panels are: (a) solar wind Vp, (b) Np (black, legend on the left) and Psw (red, legend on the right), (c) Tp (black, legend on the left) and plasma-β (red, legend on the right), (d) IMF B0, and Bx, By, and Bz components, (e) NCF (black, legend on the left) and ΦD (red, legend on the right), (f) SYM-H index, (g) SML index (black, legend on the left) and substorm numbers in each 3-h interval (red, legend on the right), and (h) FACT in the northern hemisphere (NH; black) and southern hemisphere (SH; red). The dashed vertical line indicates an FF shock, and the shaded region is an MC.
Current usage metrics show cumulative count of Article Views (full-text article views including HTML views, PDF and ePub downloads, according to the available data) and Abstracts Views on Vision4Press platform.
Data correspond to usage on the plateform after 2015. The current usage metrics is available 48-96 hours after online publication and is updated daily on week days.
Initial download of the metrics may take a while.