Open Access
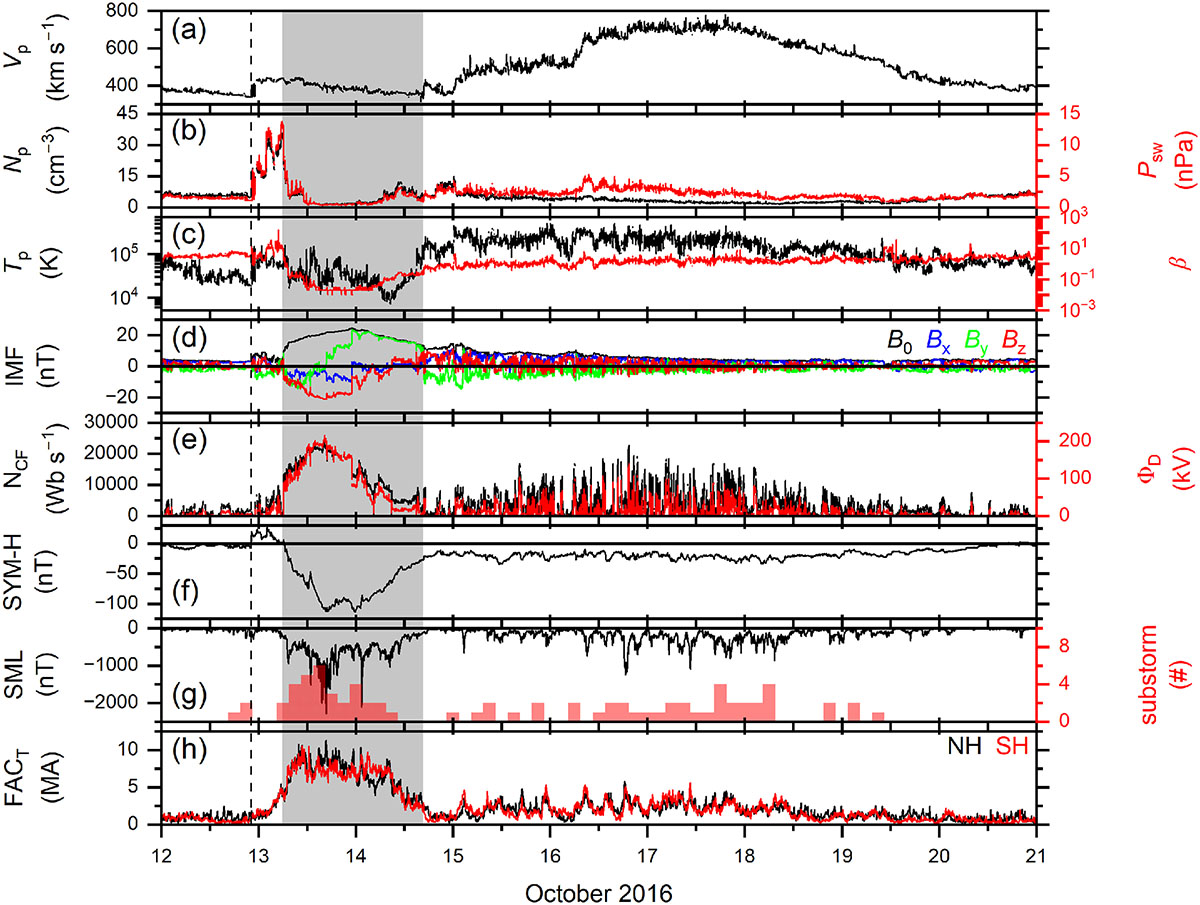
Figure B2.
Download original image
Solar wind, geomagnetic conditions, and FACs associated with an ICME followed by an HSS during 12–20 October 2016. Panels are the same as in Figure B1. The dashed vertical line indicates an FF shock, and the shaded region is an MC.
Current usage metrics show cumulative count of Article Views (full-text article views including HTML views, PDF and ePub downloads, according to the available data) and Abstracts Views on Vision4Press platform.
Data correspond to usage on the plateform after 2015. The current usage metrics is available 48-96 hours after online publication and is updated daily on week days.
Initial download of the metrics may take a while.