Figure C1.
Download original image
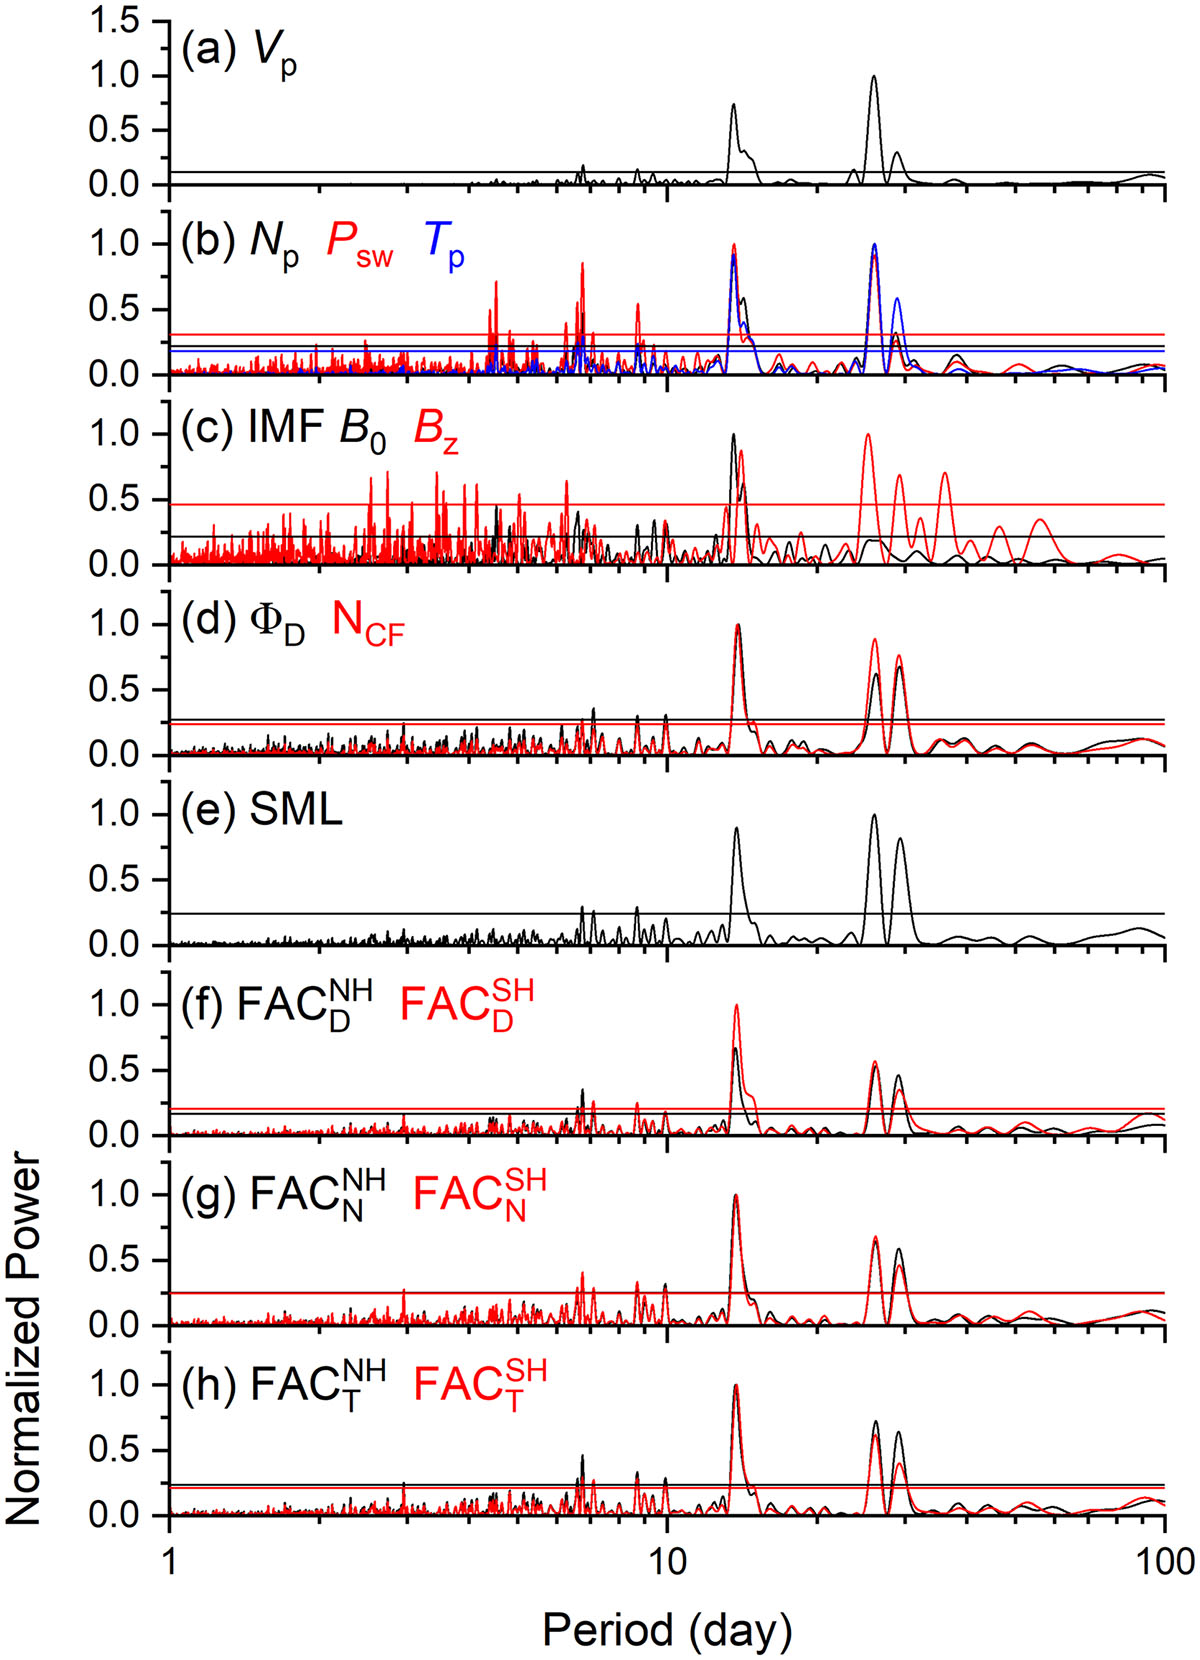
Lomb-Scargle periodograms of solar wind plasma and IMF parameters, solar wind-magnetosphere coupling functions, auroral electrojet indices, and FAC intensities. In panels (f)–(h), T represents total, D is dayside, N is nightside, NH is the northern hemisphere, and SH is the southern hemisphere. Horizontal lines in each panel indicate 95% confidence levels of the periodograms. For the periodogram analyses, we used the highest resolution data available, i.e., 2 min for FACs and 1 min for all other parameters.
Current usage metrics show cumulative count of Article Views (full-text article views including HTML views, PDF and ePub downloads, according to the available data) and Abstracts Views on Vision4Press platform.
Data correspond to usage on the plateform after 2015. The current usage metrics is available 48-96 hours after online publication and is updated daily on week days.
Initial download of the metrics may take a while.