| Issue |
J. Space Weather Space Clim.
Volume 16, 2026
Topical Issue - Severe space weather events of May 2024 and their impacts
|
|
|---|---|---|
| Article Number | 6 | |
| Number of page(s) | 16 | |
| DOI | https://doi.org/10.1051/swsc/2025059 | |
| Published online | 02 March 2026 | |
Supplementary material
Supplementary material A|
Figure A1. Data availability for multiple European ionosonde stations from 9 May to 14 May 2024, with each coloured bar representing a specific ionospheric parameter (e.g., foF2, foF1, etc.) measured at a given station over the set time.The black rectangle highlights the morning of 11 May, when the European ionosonde network experienced an “information blackout”. |
|
Figure B1. LOFAR data for observation L2040075, covering the period of May 10th from 21:35 until 23:35 UTC. The astronomical source of the signal is 3C380. The plot represents the normalised dynamic spectra of the CS002, RS106 and International LBA stations. |
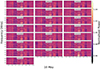 |
Figure B2. LOFAR dynamic spectra for observation L2040075, covering the period of May 10th from 21:35 until 23:35 UTC. The astronomical source of the signal is 3C380. The plot represents the data of the Core LBA stations. |
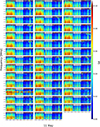 |
Figure C1. LOFAR data for observation L2040001, covering the period of May 11th from 3:40 until 11:40 UTC. The astronomical source of the signal is Cassiopeia A. The plot represents the S4 indexes, measured at 180s, of all the HBA Core antennas. |
|
Figure C2. LOFAR data for observation L2040001, covering the period of May 11th from 3:40 until 11:40 UTC. The astronomical source of the signal is Cassiopeia A. The plot represents the S4 indexes, measured at 180s, of the CS002, RS106 and International HBA0 antennas. |
|
Figure D1. Velocity measured using Fresnel algorithm for IDOLS data (blue line) at 60 MHz and for L2040001 observation (red line) at 140 MHz. |
|
Figure E1. LOFAR normalized intensity data for observation L2040063, covering the period of May 10th from 05:58 until 07:58 UTC. The blue line represents the X-ray flux from GOES. |
|
Figure E2. LOFAR normalized intensity data for observation L2040071, covering the period of May 10th from 11:25 until 13:25 UTC. Around 12:30 UTC the all the data show a rapid increment at the same instants. This represents the arrival of a solar radio burst. |
© R. Ghidoni et al., Published by EDP Sciences 2026
Current usage metrics show cumulative count of Article Views (full-text article views including HTML views, PDF and ePub downloads, according to the available data) and Abstracts Views on Vision4Press platform.
Data correspond to usage on the plateform after 2015. The current usage metrics is available 48-96 hours after online publication and is updated daily on week days.
Initial download of the metrics may take a while.