| Issue |
J. Space Weather Space Clim.
Volume 16, 2026
Topical Issue - Severe space weather events of May 2024 and their impacts
|
|
|---|---|---|
| Article Number | 15 | |
| Number of page(s) | 18 | |
| DOI | https://doi.org/10.1051/swsc/2026011 | |
| Published online | 08 May 2026 | |
Research Article
Equatorward expansion of the auroral oval during the May 2024 geomagnetic storm observed over Europe by FRIPON all-sky cameras and satellites
1
Centre Opérationnel de Météorologie de l’Espace des Alpes (COMEA), AurorAlpes 38000, Grenoble, France
2
IPAG, Univ. Grenoble Alpes, CNRS, 38000 Grenoble, France
3
Royal Netherlands Meteorological Institute (KNMI), Utrechtseweg 297, 3731 GA De Bilt, The Netherlands
4
LTE, Observatoire de Paris, PSL University, CNRS, Sorbonne Université, Paris, France
5
FRIPON International Team, Paris, France
* Corresponding authors: This email address is being protected from spambots. You need JavaScript enabled to view it.
Received:
2
May
2025
Accepted:
19
March
2026
Abstract
Context: The geomagnetic storm of 10–11 May 2024, also known as the Mother’s Day storm or Gannon storm, was among the most intense geomagnetic storms in recent decades. Such storms are associated with hazards, including induced currents in power grids, caused by intense ionospheric currents associated with auroral processes. Since the equatorward expansion of the auroral oval is related to the intensity of the storm, such intense events can affect infrastructures that are seldom exposed to such hazards. The May 2024 storm was the first event of this intensity in two decades, and therefore the first that can be studied with our current observational capabilities. Aim: The expansion of the auroral oval was observed by the FRIPON all-sky camera network, originally designed to detect fireballs. With over 150 cameras deployed globally, the network provides a valuable opportunity to map the evolution of the auroral oval’s expansion at relatively low latitudes during the night. In addition, several Low Earth Orbiting satellites with capabilities to observe auroral processes passed over Europe during the night of the storm, allowing us to compare their observations. Methods: In a proof-of-concept approach, we analyse the evolution of the brightness intensity at zenith for each FRIPON camera in Europe. This simple technique enables the tracking of the Southern limit of the visible aurorae over time. The results are compared with ground magnetometer measurements, optical satellite remote-sensing observations of auroral emissions, field-aligned currents from magnetometers on the Swarm satellites and enhancements in ionospheric Total Electron Content (TEC) obtained from Global Navigation Satellite System (GNSS) receiver networks. Results: We observe that the aurorae extend as far south as 46° N geographic (42° N Quasi-Dipole geomagnetic latitude), a significantly lower position than predicted by some models. In addition to this observation, a faint increase in luminosity was detected over the zenith for a large majority of cameras across Southern Europe witnessing a Stable Aurora Red (SAR) Arc, spanning from 37° to 50° in latitude. Conclusions: This work validates the use of the FRIPON network (or other similar networks) for Space Weather research. Complementary to other Space Weather instruments, it may help in studying the dynamics of the auroral oval.
Key words: Deployment of the auroral oval / May 2024 severe storm / All-sky camera network
© O. Katz et al. Published by EDP Sciences 2026
 This is an Open Access article distributed under the terms of the Creative Commons Attribution License (https://creativecommons.org/licenses/by/4.0), which permits unrestricted use, distribution, and reproduction in any medium, provided the original work is properly cited.
1. Introduction
The geomagnetic storm of 10–11 May 2024 was the most significant geomagnetic storm of solar cycle 25 so far. For the first time in many years, aurorae could be distinctly observed from mid-latitudes all around the world (Grandin et al. 2024). It is carefully described in (Hayakawa et al. 2025; Kwak et al. 2024) and will therefore not be reviewed in its full extent here. Our aim is rather to use this storm to demonstrate the use of the Fireball Recovery and InterPlanetary Observation Network (FRIPON) to observe the auroral oval deployment over mid-latitude Europe during this event.
The FRIPON Cameras Network is a scientific project originally designed to automatically observe, analyse and determine the trajectory of fireballs using cameras. Our goal is to provide a proof of concept for using this near real-time network in a Space Weather context and to demonstrate its potential for auroral observations. To this end, we present series of measurements of the latitudinal southern limit of the Northern Hemisphere auroral oval during the time of its peak activity over Europe.
One motivation for this work is the existing limitations in observational and modelling capabilities when it comes to very intense geomagnetic storms. Ground-based infrastructures dedicated to auroral studies poorly cover the mid-latitudes, and the empirical auroral oval models fail to correctly predict the oval expansion under exceptionally strong driving. As far as ionosondes are concerned, two recent articles show the difficulty when looking at low latitude ionosphere (Koloskov et al. 2023; Campuzano et al. 2023). A good review of the geographical coverage provided by magnetometers may be found in (Kudin et al. 2021). Most of the Incoherent Scatter radars are located at high latitude, especially these with an open access to the data, and after Arecibo was damaged. Coherent scatter radars are operating as well mainly at the high latitudes. There is therefore a need for further investigating how to explore the middle – low latitudes upper atmosphere especially during strong geomagnetic storms.
As will be shown in this paper, sub-auroral phenomenon such as Stable Aurora Red (SAR) Arc have been detected by the Fripon network. Such arcs have been observed for long. A still accurate description may be found for example in Nagy et al. (1970). The authors mention the SAR arc as a type of very stable polar light, homogeneous over time. It emits in the oxygen forbidden line at 630 nm at an average altitude around 400 km (from 200 km to 800 km) with a longitudinal stability over several hundreds of kilometers. Such phenomenons are attributed to electron heating by the inner magnetospheric heat flux. Still, the phenomenon is not completely understood and recent studies such as (Liu et al. 2025) and (Martinis et al. 2022) provide insight of their formation mechanism whether it is main phase or recovery phase and associated with subauroral polarization streams (SAPS) and Subauroral Ion Drift (SAID). This network may become therefore an opportunity for the space weather community to better access the mid-latitude thermosphere/ionosphere.
This paper is organized as follows:
-
We first describe the FRIPON camera network so that readers can access and use its data. We also describe the other instruments used in this work, namely the SuperMAG and INTERMAGNET magnetometer networks, as well as the VIIRS space instruments and the magnetometers on board SWARM.
-
We then detail the technique used to process and analyse the FRIPON data.
-
The “results” section is divided in several parts. We first explore the equatorward progression of the auroral oval through observations made by several instruments and through geophysical indices. In this context, we show how FRIPON compares with ground based magnetometers and space observations.
-
We then explore the physics of the observations, and show that they are compatible with the presence of a Stable Aurora Red (SAR) arc.
-
Although low latitude models are sparse and mainly empirical, we compare our results to three of them, showing that they hardly forecast the observations.
-
We finally summarise and conclude the paper in Section 7.
2. Data sources
2.1. FRIPON all-sky camera network
The FRIPON network1 uses monochromatic all-sky cameras located around the world (Fig. 1, upper panel) (Colas et al. 2020). The network’s main purpose is to detect fireball trajectories. The trajectories and brightness variations of the fireballs are estimated by triangulation. It is then possible to invert the trajectories to retrieve their orbits within the Solar System, or to determine the strewn field of possible meteorite falls. To this end, the video frame rate is 30 frames per second (fps). In the network regular operating mode, only data with a positive detection are stored at this frame rate. However, a 5 s exposure image is taken every 10 min for astrometric and photometric calibration. The present work is based on the use of these images to monitor the variations in brightness of the night sky. The locations of the cameras used for the data analysis across Europe are plotted in Figure 2, together with the locations of the other observations available in the area.
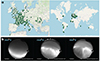 |
Figure 1. Upper panel: The referenced station localisation of the FRIPON network over Europe and the World on April 2025 (OpenStreetMap/FRIPON). Lower panel: Evolution of the auroral structure over Longville-in-the-Dale (England, 52° 32′ 21′′ N, –2° 40′ 51′′W) from 22:02 UTC to 22:22 UTC on 10 May. In this figure, the 3 pictures are uncalibrated and unprocessed (northward direction at the bottom of the images). |
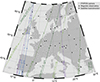 |
Figure 2. Map of the data acquisition locations. White circles markers represent FRIPON all-sky cameras, black diamonds markers are stations that have provided SuperMAG ground magnetometer data and satellite ground-tracks annotated with the flight directions, the satellite names and UTC times of the start and end of the pass through the map area. Lines of constant quasi-dipole magnetic latitude have been added in gray and annotated on the inside of the frame. |
Each FRIPON station consists of a Linux-based minicomputer, a wide-angle camera, and a managed switch that ensures isolation from the host institute’s network. The installation is done with an automated deployment system based on a USB key. The minicomputer is used both for the acquisition, the temporary storage of long-exposure captures and meteor detection through the FreeTure open-source software and a set of scripts. The data, which include astrometric long-exposures images, single detection (stacked images), and multiple detection (both optical and radio raw data) are subsequently transferred to the central server. The collected data are then indexed in a database. During this operation, visuals are generated for inspection. The interface makes it possible to display and download data as an archive that complies with the data policy of the project by means of access-right management.
Each FRIPON camera uses a Sony ICX445, a monochromatic charge-coupled device (CCD) chip with 1296 × 964 px2 resolution and a pixel size of 3.75 × 3.75 μm2. The optics consists of a 1.25 mm focal length f/2 fish-eye camera lens, which leads to a pixel scale of 10 arcmin. The network is designed with a median distance of 80 km between cameras, to ensure an accurate triangulation of fireball events. The optical device and the CCD are embedded into a case sealed with a transparent dome. These cases are equipped with a passive radiator, which serves to release the heat produced by the electronics during the warmer periods of the year to minimize CCD dark current.
Each camera is controlled by an Intel NUCi3 computer on which the data are temporarily stored. A single Power-over Ethernet (PoE) cable is used for data transfer and for powering and remotely managing the camera through a manageable TP-Link switch. Such a solution makes it easy to install the optical station to operate it remotely and to use cables up to 100 meters long between the camera and the computer.
Each FRIPON station is auto deployed using a dedicated Debian Preseed file. On first boot, new stations connect to a Virtual Private Network (VPN) dedicated to the FRIPON network. After an automatic remote configuration (supervision systems, scripts, partitioning, time server, ...), the station becomes operational and visible in the FRIPON network.
The presence of more than 150 cameras across Europe, in combination with a particularly clear sky throughout the continent during the May 2024 geomagnetic storm event, enabled the network to successfully capture the aurorae. Thereby enabling the precise observation of the geographical and temporal evolution of the auroral structure at the 10-min cadence of the stored images. As an example, three images are shown in Figure 1 (lower panel) over Longville-in-the-Dale, England covering 22:02 to 22:22 UTC.
Using webcams to observe aurorae is certainly nothing new. The actual advantages of the FRIPON network are that (1) it is able to provide calibrated observations of night-sky brightness and (2) it might be able to close observational gaps at mid-latitudes where networks of dedicated auroral imagers (or airglow imagers with similar capabilities) are rather sparse.
2.2. SuperMAG magnetometer network
SuperMAG2 is a worldwide collaboration of organizations maintaining ground-based magnetometers, aiming to facilitate access to commonly processed magnetic perturbation data (Gjerloev 2012). We obtained global magnetic variation data at 1-min resolution for 10 and 11 May 2024 from the SuperMAG large downloads interface. Only data from the European stations in the map of Figure 2 are included in this paper. We also obtained the SuperMAG Upper (SMU), SuperMAG Lower (SML) auroral electrojet indices Newell & Gjerloev (2011) and SuperMAG Ring-current (SMR) index Newell & Gjerloev (2012) to provide a global context on the evolution of these current systems during the storm.
2.3. INTERMAGNET magnetometer network
INTERMAGNET3 is a magnetometer network created by the International Association of Geomagnetism and Aeronomy (IAGA) in 1987. Its aim is to establish a global network of cooperating digital magnetic observatories to facilitate data exchanges and the production of geomagnetic products in near real time. It links 156 magnetic observatories operated by 51 different institutes (September 2025) throughout the world on all continents, including the Arctic and Antarctica.
2.4. Swarm field-aligned currents
The European Space Agency (ESA) Swarm mission was launched in 2013. It consists of three polar-orbiting satellites, of which two (Swarm A and C) fly in close formation at the same altitude (around 485 km in May 2024), while the third (Swarm B) flies at a slightly higher altitude (515 km) and in an orbit with a different orientation, resulting in a different drift rate of the local time at the ascending node. Figure 3 shows the orientation of the orbital planes during the storm, with Swarm A (and its twin Swarm C, flying less than 140 km apart, but not shown here) entering the Northern Hemisphere in the early morning and leaving it in the early evening. The Swarm B satellite entered the Northern Hemisphere shortly before midnight, and was therefore better positioned for observations in conjunction with those from the ground during the night. The locations of Swarm passes over Europe during the night of 10–11 May 2024 are available in Figure 2.
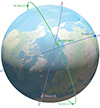 |
Figure 3. Relative locations of the Low Earth Orbiting satellites NOAA-21, Swarm A and B at 23:38 UTC on 10 May 2024. The orientations of the orbital planes and day-night boundary in this image are nearly constant during the interval of the storm. |
Each Swarm satellite carries highly sensitive magnetometers, as well as other instruments. The magnetometer data allow the reconstruction of field-aligned current density at high latitudes, under certain assumptions (Ritter et al. 2013). These currents are caused by the energetic charged particles that travel along the field lines that connect the distant magnetosphere with the upper atmosphere.
The brightness and visibility of aurorae depend on several factors in addition to the field-aligned current density, most notably on the nature and energy of the charged particles and on the state of the neutral atmosphere. The relationship between the locations of strong field-aligned currents and auroral particle precipitation was investigated by Xiong et al. (2020). The equatorward boundary of storm-time aurora tends to coincide with regions of strong field-aligned currents. For this study, we used the Swarm Level 2 field-aligned current data product FACxTMS, which is derived from the processing of data from each satellite individually. For this product, the convention is that negative values represent upward currents.
2.5. VIIRS day-night-band remote sensing images
The VIIRS instrument (Visible Infrared Imaging Radiation Suite) is available on three satellites, developed by the US National Aeronautical and Space Administration (NASA) for the National Oceanic and Atmospheric Administration (NOAA), as part of their Joint Polar Satellite System (JPSS). The three satellites are SUOMI-NPP (launched in 2012), NOAA-20 (launched 2017) and NOAA-21 (launched 2022). These are polar orbiting Sun-synchronous satellites, at an altitude of approximately 830 km, descending over the equator on the nightside of the Earth at about 01:30 local time. In May 2024, all three satellites were in this same orbital plane, passing over the night-side aurora in the post-midnight sector, but they were spaced to pass about one fourth or one half orbit apart (see Fig. 3), providing a denser ground-track spacing and temporal sampling than is possible with just one of these satellites.
The VIIRS instrument on the JPSS satellites is a whiskbroom scanner radiometer, providing data in twenty-two different bands across the infrared and visible spectrum, used for meteorology and monitoring of natural hazards and the environment. For this study, we used the Day-Night Band (DNB) described by Miller et al. (2013), which is sensitive to low-light emission sources such as city lights, moonlit ice and clouds as well as the aurorae. We used the L1B data product which provides the radiances and geolocation information in files covering six-minute time intervals. The geolocation algorithm was made for ground-based light sources, so it is less accurate in the cross-track direction when high-altitude auroral emissions occur. We have therefore selected only the part of the observations located directly below the satellite in our analysis of the global auroral boundaries.
2.6. Ionospheric Total Electron Content from GNSS receiver networks
We have used ionospheric Total Electron Content (TEC) observations, obtained from processing at Massachusetts Institute of Technology (MIT), of data from several GNSS receiver networks (Rideout & Coster 2006; Vierinen et al. 2015), made available via the Madrigal data portal4. The measurement principle is based on the differential delay between two GNSS frequencies, caused by the presence of ionospheric electrons between receivers and GNSS satellites. By combining many GNSS satellites and many ground receivers, resolving the biases, and mapping to a standard ionospheric height, the number of electrons in a unit area column can be resolved on a global grid. This works particularly well in areas with a large number of receivers, such as Europe and North America. The data product was already used by Foster et al. (2024) to study the auroral intensification and extent over North America during the May 2024 storm, in combination with citizen scientist all sky camera images. Its use in our study focusing on the use of the FRIPON all sky cameras in Europe is therefore a natural extension of the use of this type of observation.
3. FRIPON data processing and analysis
3.1. Retrieving absolute photometric values from FRIPON data
The raw CCD images are not pre-processed: neither black nor flat-field corrections are applied. All the cameras are identical. The absolute calibration and intercalibration are performed monthly by renormalising all detected stars (with stars of magnitude ≤4.5) in the 5-s exposure images of the astrometric and photometric data (Jeanne et al. 2019). A comparison of the observations with the Hipparcos catalogue (Bessell 2000) allows us to obtain an accuracy of one-tenth pixel or 1 arcmin and a photometric accuracy of 0.1 mag. The analogue-to-digital units (ADU), i.e. the digital representation of the electrical charge for a given pixel is given through the astro-calibration file for each camera.
To employ this network for auroral monitoring, the mean pixel intensity is first converted into a physical astronomical unit. The initial step involves subtracting the CCD offset. For each file, the mean intensity is measured outside the fisheye image circle, and this value is subsequently subtracted from the full image. The flux of a magnitude 0 star at the zenith (Flux0Zenith) is then collected using the astronomical calibration file along with the ADU described above.
For FRIPON cameras, a single pixel size is 3.75 μm and the focal length of the lens is 1.25 mm, so the angle θ subtended by one pixel can be calculated as:
 (1)
(1)
This must be converted into arc-minutes as follows:
 (2)
(2)
to obtain the angular area covered by a single pixel:
 (3)
(3)
With this, we can finally calculate the absolute photometric values in mag arcsec−2:
 (4)
(4)
3.2. Detection of aurorae at zenith
Our aim is to show that this network, originally designed to observe fireballs, can also be used for Space Weather purposes. Therefore, we do not use the full capabilities of the 1296 × 964 px2 CCD but as a first approach, we only look at the mean intensity over a 20 px × 20 px matrix centered at the zenith. This simple approach enables us to analyse the evolution of the oval during the event in a straightforward manner. Note that the cameras do not have the same orientation relative to each other. This is not a constraint for this method but could be a limitation for other analyses requiring alignment using astrometric or technical data. The zenith position of each camera is determined using the astrometric calibration file described above for each detector.
However, this process is based exclusively on intensity, which impedes the ability to differentiate between aurorae and other light phenomena. A systematic human visual analysis is performed before the zenith detection process to check cloud coverage and to discard images affected by clouds or by artificial light directed towards the sensor. This manual analysis yields a total of 97 usable FRIPON cameras during the May 2024 event, out of approximately 150 theoretically available.
4. Results
4.1. Global context of the extent of the aurora
Figure 4 provides an initial view of the progression of the geomagnetic activity and extent of the auroral oval during the storm.
 |
Figure 4. Global indicators of the progression of the storm from SuperMAG ground magnetometer indices and polar satellite data. Time in UTC. |
Panel (a) shows the SMR index, indicating magnetospheric ring current intensity. The graph shows the typical initial (positive SMR) and main (increasing negative SMR) phases, of coronal mass ejection driven storms (Mouikis et al. 2019; Baatar et al. 2023). However, the recovery phase is prolonged by the arrival of additional coronal mass ejections, causing the SMR index to remain at very high negative levels for a prolonged period of time (Hajra et al. 2024).
Panel (b) shows SML/SMU indices, indicating the strength of the auroral electrojet currents. Strong spikes, in particular in the SML index (lower bound) tend to indicate substorm activity, which are usually accompanied by brightening and spreading of optical aurorae. Indications of strong substorm activity are visible in this graph especially during the first three hours of the storm (17:00 to 20:00 UTC) while Europe was still largely in daylight, and between 22:00 and 23:00 UTC. Further substorms around 09:00 UTC and slightly before 10:00 UTC occurred during the European morning hours.
Panels (c) and (d) show VIIRS DNB radiances in the Northern and Southern Hemisphere, respectively, indicating the magnetic latitude extent of visible aurora at nighttime. The y-axis for the Southern hemisphere data has been flipped (upwards for larger negative latitudes) to enable easier comparisons between the hemispheres. In further mentions of positive magnetic latitudes when discussing these (sub)figures, these can be interpreted to apply to equivalent negative (Southern) latitudes as well.
The Southern hemisphere VIIRS DNB data show a much better coverage, because of the much larger night-time area during the local wintertime. Also, the larger offset between the magnetic and geographic poles plays a role in the better Southern hemispheric coverage, when looking at nighttime satellite data in quasi-dipole coordinates. It is interesting to note the presence of non-stormtime aurora between around 65° and 75° magnetic latitude at the start of the time interval (15:00–17:00 UTC), and compare it against the stormtime variations. When the storm starts, the data show a clear intensification and equatorward expansion until about 23:00 UTC, matching the main phase from the SMR index in panel (a). The radiance colour scale range, reaching 5 10−9 W cm−2 sr−1 was chosen to highlight the lower latitude extent of even faint aurora, at the cost of losing detail in the blown-out parts of the brightest aurora, which regularly exceeds roughly four times higher values even outside of storms, and ten times higher values during this extreme storm. Nevertheless, the observations show several satellite passes where (faint) aurora reaches 40° magnetic latitude, in particular during the times of substorm activity, mentioned in the discussion of panel (b).
Finally, panels (e) and (f) show field-aligned currents from Swarm A and B, respectively, indicating their variability and magnetic latitude extent. Data from Swarm C was not included, since due to its close proximity to Swarm A, it did not offer much additional information for our purposes. The advantage of the Swarm data over the VIIRS DNB data is that observations are available during both day and night, and at different local solar times. Both Northern and Southern Hemisphere passes could be displayed in the same panel, and have been marked with an ‘N’ and ‘S’ at the top, for the northernmost and southernmost points in the orbit, respectively.
The Swarm data show the same broad variations in latitudinal extent as the VIIRS data, but there is more pass-to-pass variability, which is most likely due to the wider range of local times covered, including local times that are 12 h apart for each satellite, on its ascending and descending parts of the orbit, and therefore covering both night-time and sunlit conditions. It is also clear that strong field-aligned currents are still present at latitudes poleward of the brightest optical aurora. This matches with the understanding that field-aligned currents are a necessary but not an exclusive condition for visibility of the aurora (Xiong et al. 2020). The type (protons or electrons) and energy range of the particles generating the currents, and conditions in the upper atmosphere, play a role as well, however these characteristics were not observed by these satellites.
The largest equatorward extent of the currents is observed between about 02:00 and 03:30 UTC, reaching 40° magnetic latitude. However, strong equatorward excursions were also observed earlier and later in the night. The earlier excursion in particular, between 22:00 and 23:00 UTC, turned out to be important for auroral observations from Europe, as will be discussed in subsequent sections.
4.2. Geographical maps of FRIPON and magnetic observatory data
Figure 5 shows a sequence of geographical maps of the FRIPON and SuperMAG observations over Europe. To highlight the nighttime variations, FRIPON station brightness at zenith was plotted relative to that of 21:40 UTC for each station, so that the data points represent relative magnitude variations. This time period was chosen because it was night in most of Europe and because the aurora started to become visible at zenith in the northern part of the United Kingdom (UK). This compromise could reduce the measured luminosity intensity over part of the UK, as it was not completely night-time. However, this limitation will not affect our methodology as we analyse the Southern boundary of the auroral oval. For the magnetic observatory data, the eleven individual one-minute SuperMAG horizontal perturbation vectors for the ten-minute window surrounding the time tag were plotted, so that short-term variations can be deduced from the spread of the one-minute vectors. The magnitude of the largest magnetic perturbation is printed underneath each station location. The four differently grey-shaded zones in the background, from lighter to darker, indicate the boundaries of solar elevation angles of 0, −6, −12 and −18°, according to the definitions of dusk and civil, nautical and astronomical twilight.
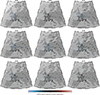 |
Figure 5. Sequence of maps showing FRIPON (circles) and SuperMAG (diamonds with vector arrows) observations on 10 May 2024 White lines indicate QD magnetic latitudes, all time stamps refer to UTC, and relative FRIPON brightness refer to the respective values at 21:40 UTC. |
The 20:30 UTC timestamp (top left) was included to show the variation in relative brightness over the FRIPON network around the time of sunset, for comparison with the auroral variations later during the night. Subsequent frames show the progression of the most prominent aurora over Western Europe during the night.
The SuperMAG data in Figure 5 indicate that the largest mid-latitude magnetic perturbations occurred over Eastern Europe (most notably Poland, Finland and the Baltic states), where FRIPON station coverage was sparse. Nevertheless, while the stations show mostly darkness at 22:00 UTC, from 22:10 UTC, we see aurora develop over the stations in the UK, The Netherlands, East Germany and Northern France, reaching peak brightness at about 42° quasi-dipole latitude at 22:20 UTC. At around 22:30 UTC, we also see some stations in Southern France and Northern Italy light up, even though stations at higher latitudes now appear dimmer than before. Between 22:40 and 23:10 UTC we see both magnetic perturbations and FRIPON brightness values decrease over time.
4.3. Comparison with magnetometers
We compare the FRIPON optical observations to the horizontal magnetic field measured over Europe with the INTERMAGNET network (Kudin et al. 2021). Using INTERMAGNET or SuperMAG as in Section 4.1 gives the same results, but one of the magnetometer in use was missing in the SuperMAG network. The list of magnetometers used for this comparison is given in Table 1. The easternmost one is 93.48° and the westernmost one is 75.46°. We chose the magnetometers and the cameras so that they are approximately aligned along three similar meridians and we compare the camera intensities to the closest magnetometer.
Quasi Dipole geomagnetic coordinates (in degrees) of the INTERMAGNET magnetometers used in this study. Column one: full name, country. Column 2: Acronym. Column 3: Magnetic latitude. Column 4: Quasi Dipole geomagnetic longitude.
The results are shown in Figure 6 for group 1 and 7 for group 2.
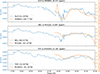 |
Figure 6. Blue line: Total local magnetic field intensity (nT) at stations HLP, BEL and THY (please refer to Table 1 for details). Orange: Comparison with the closest FRIPON camera at zenith (mag arcsec−2). The Quasi Dipole geomagnetic latitudes are given in the legend. |
The Brightness is systematically plotted on the same scale. Brightness is measured in mag arcsec−2 which is not a standard unit for auroral measurement but more common in other astronomical field. It is important to keep in mind that a lower value mean a higher brightness. The minimum is set on 21.8 mag arcsec−2 as it is commonly described as the brightness value for a very dark sky without light pollution. The maximum is set on 16 mag arcsec−2 and describes a brightness of the sky that we can usually measure during the twilight. The agreement between the total magnetic field and the optical measurements is quite good on all occasions. Still, some care must be taken in such a comparison. Indeed, the major mid-latitude features of the storm were almost at continental-scale, and therefore quite similar across all locations. Besides, with individual ground magnetometers we cannot easily distinguish between strong but further away or weak but overhead currents. In spite of these considerations, this comparison tends to indicates that the cameras are correctly measuring ionospheric events.
4.4. Time variation of auroral latitudes over Europe
In Figure 8 the brightness values from the zenith detection by the FRIPON network in panel (a) is compared with the variations in ionospheric TEC from the Madrigal maps of the middle panel (b) and the geomagnetic perturbation data from SuperMAG contributing stations of the lower panel (c). FRIPON observations are the values at nadir, with the value at 21:40 UTC subtracted, as it was done on Figure 5. All TEC and magnetic observatory data points were first filtered for the European longitude range of –15° to +30°. Each TEC grid map location and magnetic observatory location was converted to quasi-dipole coordinates, and for each time step, the observations were binned by quasi-dipole latitude in one degree bins, taking one data point or the average of a few data points in each bin. The white horizontal lines in panel (c) indicate that no stations were available in the SuperMAG data for those quasi-dipole latitude bins. Note that, due to the distribution of the contributing stations, the TEC and SuperMAG panels (b) and (c) have a much wider latitude range in Figure 8 of 30–80°, while the quasi-dipole latitude range for FRIPON in panel (a) is 35–50°.
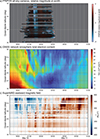 |
Figure 8. FRIPON zenith observations (panel a) compared with other indicators of auroral latitudes: total electron content (panel b) and magnetic field perturbations (panel c). The time is shown in UTC. |
Panel (b) shows the usual large low-mid-latitude dayside TEC signal, which is mainly due to photo-ionization by solar EUV, in the bottom-left corner. After sunset, the auroral heating, expansion and associated composition changes in the neutral upper atmosphere causes the ionospheric F-layer to largely disappear due to enhanced recombination rates (Wang et al. 2010). The remaining signal during the night is understood to be due to auroral precipitating particles (Foster et al. 2024). In the auroral oval and enlarged polar cap, above approximately 50° N, we see a good resemblance in the timing and latitude of TEC enhancements in panel (b) and magnetic field variations in panel (c).
The FRIPON data in panel (a) very clearly shows strong auroral brightness enhancements between approximately 22:15 and 23:15 UTC, which seems to start at higher latitudes, drops in intensity around 22:30 UTC, and briefly flares up again shortly afterwards. This coincides strikingly with the lowest latitude night-time TEC enhancement in panel (b) and magnetic perturbation in panel (c), happening at the same time. Looking back at Figure 4, we can see that the timing of this event over Europe coincides with a period of large enhancements and equatorward expansion of visible aurora seen by VIIRS-DNB and Swarm field-aligned currents, at different local times and in different longitude sectors. Such field aligned currents may often be associated to auroral activity (see for example Qu et al. 2024 and references herein). This indicates that these variations in the FRIPON signals indeed originate in large-scale auroral processes.
Note that some cameras still get some abrupt changes in brightness, especially during the second part of the night below 40° latitude. This is not the consequences of auroral activity, but of clouds or artificial light. Those cameras have been kept despite this inconvenience as it allows a proper analysis of the maximum peak of activity.
4.5. Comparisons with satellite observations
To demonstrate how the FRIPON observations match with satellite observations, Figure 9 shows maps for three different times. At 22:15 UTC (left panel), we see the strongest and best-delineated auroral signature of the night over Europe in the TEC observations, roughly coinciding in timing with a pass of Swarm B showing strong field-aligned currents over Poland. This coincides with the previously discussed FRIPON observations over the UK, The Netherlands and Eastern part of Germany at similar magnetic latitudes. In the center panel of Figure 9, we see that the auroral signature in the TEC data at 22:30 UTC has become more diffuse. However, the peak TEC can still be seen over Poland, extending east to west at similar latitudes as before. But now, interestingly, the maximum brightening in the FRIPON network can be seen over France and Southern Germany. An example of pillars captured by a FRIPON camera located at 47° N geographic in France can be seen in Figure 10. The final frame, at 23:25 UTC, showcases the alignment of aurora observed by VIIRS-DNB on NOAA-21 on the eastern edge of the map, with the TEC in the layer underneath. By this time, the auroral oval has clearly retracted to above 50° magnetic latitude, and outside the range of the FRIPON network’s cameras.
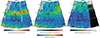 |
Figure 9. Sequence of maps showing FRIPON observations (circles) on 10 May 2024 in context with total electron content maps, Swarm field-aligned currents and VIIRS-DNB night-time imagery. |
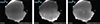 |
Figure 10. Auroral pillars seen at zenith by the Besançon detector (47° 14′ 48′′ N, 5° 59′ 21′′ W). Northward direction at the bottom of the images. |
This Southern extension becomes more visible on the same camera when looking that the keograms (Fig. 11). Keograms are an effective way to easily observe the propagation of the aurora on a given night. For each picture, a 40-pixel wide north-south strip is extracted from the full image, and all the strips are assembled into time-dependent graphics. Here, the northernmost pointing corresponds to the ground and the southernmost to the trees as seen in Figure 10. The straight line represents the zenith. An offset subtraction has been proceeded. The aurora is clearly visible at 22:20 UTC. Its expansion toward the zenith and to the Southern part of the sky occurs over the next 20 minutes ans then retracts to the North. From 0:30 UTC to 2:00 UTC, the aurora is clearly seen to the north, approaching the zenith at about 01:00 UTC.
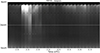 |
Figure 11. Keogram from the Besançon detector at 42.227° N Quasi Dipole geomagnetic (47° 14′ 48′′ N, 5° 59′ 21′′ W). The dashed line represents the zenith. |
Looking back at Figure 8 (upper panel), we can clearly distinguish the two peak of activity. During the first peak of activity over Europe around 22:37 UTC, the relative brightness at zenith is increased down to 40° N Quasi Dipole (QD) geomagnetic latitude. We observe a second peak of activity, near 01:00 UTC. This one is weaker than the first one, but can still be distinguished over zenith down to 47° N QD. Still, the increase in brightness shows the appearance of aurora even lower in latitude, to 37° N QD geomagnetic latitude.
5. SAR Arc detection
As previously mentioned, Figure 8 shows an increase in brightness down to 37° N QD geomagnetic latitude during the peak of activity from 22:15 UTC to 23:15 UTC in most of the available cameras. Although faint, this change closely follows the extension of the oval. Another increase is observed around 23:15 UTC from 40° to 43° N QD geomagnetic latitude. This slab covers south of France, Northern Italy, Romania.
This increase in brightness clearly follows the magnetic activity during the night. Looking at Figure 12, we can see that this increase in brightness is due to the appearance of a faint, uniform and homogeneous layer over the 2500 km covered by the FRIPON cameras in longitude.
 |
Figure 12. Different captures showing very faint homogeneous aurorae over zenith. The first one during the peak of activities, the 3 other show a stable arc afterwards. Coordinates are quasi-dipole geomagnetic. Northward direction at the bottom of the images. |
This increase can be interpreted as the presence of a Stable Aurora Red (SAR) arcs. SAR arcs are known to be visible south of the auroral oval extent, during magnetic storms as first understood by Rees & Akasofu (1962) on Figure 12, Auroral pillars can be observed on the northern horizon. We can estimate their location as being 400 km to 800 km northward by assuming an average altitude from 200 to 400 km and knowing the observation angle from the Fripon camera description (Jeanne et al. 2019). Therefore, the auroral pillars observed from 38° QD latitude should be located between 41.5°N QD and 45°N QD, which is coherent with our previous observation.
SAR Arcs are also well known to appear frequently as observed by Alekseev & Ievenko (2008) during solar cycle 22. It is out of scope of this article to provide a full bibliography about SARs, since this is a full domain of publications.
Through an exhaustive visual analysis, a layer was observed in most of the cameras in the geographical area mentioned. Despite the lack of colour on the FRIPON images, observation from the network match the above description of SAR Arc. This homogeneous, stable and diffuse layer always follows the extension of the structured aurora, but is always further south. This observation also seems to confirm the analysis in Spogli et al. (2024), which suggests the presence of a SAR aurora around 45° geographic latitude, deduced by enhancements the Rate of the TEC change index. This index, called Rate Of TEC Index (ROTI), is a measure of ionospheric variability obtained from GNSS measurements, (Pi et al. 1997). This phenomenon seems to be the most robust explanation for the current observations at zenith with the FRIPON cameras. The presence of SAR Arc would also explains why red aurorae have been captured by different astrophotographers during this event at very low latitudes, down to 19° N QD geomagnetic latitude5. This observation can be correlated with all sky imagers from the Boston All-Sky-Imager-Network6. Those All-Sky imagers aim at studying the sub-auroral ionosphere and thermosphere and therefore images are available in different wavelengths including 630 nm. In Figure 13 we can confirm, using the All-Sky Imaging Air-Glow Observatory (ASIAGO, northern Italy 45°51′59′′ N,11°31′34′′ E), that a 630 nm emission was visible at zenith during almost the entire night. While it can be observed from zenith to the northward horizon around 22 h UT, the 630 nm is covering the entire sky and is saturating the sensor at 22 h34 UT. By comparing with the 557,7 nm sensor, we clearly see pillars in the northern horizon, but no specific emission at zenith, confirming a predominance in red emission in low latitude Europe. This observation is another strong argument to asses the presence of SAR Arcs around 40° latitude during this night.
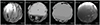 |
Figure 13. Different captures showing 630 nm – red (first 3 captures) and 557,7 nm – green (last capture). |
Interestingly, despite the formation of the SAR arc being expected, we detected it at a lower geomagnetic latitude than that usually mentioned in the literature cited above. This can be explained by the fact that most studies observe such phenomena during moderate geomagnetic storms, which are not frequent. Nonetheless, studies of the SAR arc during the December 1971 geomagnetic storm show that such structures could be observed at latitudes as low as 40° N (Maier et al. 1975) which supports our hypothesis.
6. Comparison with empirical auroral oval models and tools
The general public and Space Weather users often use auroral oval models to predict where aurorae could appear or be seen. A short comparison between these tools and our observations is useful for highlighting their limitations during strong geomagnetic events. For this comparison, we selected three different tools or models that are frequently used: OVATION, Auroraesaurus, and the auroral oval modelling from the Geophysical Institute of the University of Alaska Fairbanks. The results are shown in Figure 14.
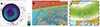 |
Figure 14. Left panel: OVATION Prime model projected using the NASA Community Coordinated Modeling Center et 22:36 UTC. Middle panel: aurorasaurus at 22:45 UTC. Right panel: Geophysical institute of the University of Alaska Fairbanks model on 11 May 2024. |
Within the scientific community, it is widely acknowledged that OVATION is frequently used in Space Weather communication to indicate locations where the aurorae can be anticipated and observed with a reasonable degree of reliability (Machol et al. 2012). In this model, during magnetic peak activity (22:36 UTC), the equatorward boundary of the auroral oval remains above a latitude of approximately 50° (typically above Birmingham, UK). It is located much further north than we can observe using the FRIPON network. OVATION is not designed to project the oval expansion during a strong event. However, as it is frequently used by Space Weather center and scientists (mainly for outreach communication)during geomagnetic storms, it is important to note that we observe a difference of between 500 and 1000 km (including or excluding the SAR Arc) between the model and our observations.
Auroraeaurus (MacDonald et al. 2015) is a citizen science initiative that is focused on collecting and analysing public observations of the aurora. This tool enhances the accuracy of forecasts regarding the visibility of the aurora. The oval expansion model in Auroraesaurus is based on OVATION; therefore, the Southern boundary is the same. Auroraesaurus provides an estimate of the visibility limit based on ground observations. The aim of this limit is to show the location from where it should be possible to observe aurora by naked eye. However, this limit is much higher in latitude than what show the Fripon network and does not accurately represent how low aurorae could be seen (in latitude). Other studies have already highlighted the underestimation of the visibility line by different tools, including Auroraesaurus (Case et al. 2016). This new observation highlights the difficulty of determining whether or not aurorae are visible. As previously mentioned, the presence of the SAR arc could explain the difference in the southward visibility boundary. When considering the screening effect due to the curvature of the Earth, such arcs located at an altitude of around 400 km could theoretically be seen at a distance of approximately 1000 km, which means up to 10° of latitude lower than the latitude on which auroras are formed.
Conversely, the oval modelling from the Geophysical Institute of the University of Alaska Fairbanks (IUAF) accurately indicated the likelihood of auroral occurrences comparable to our observations7. The temporal precision of this forecast is limited: the model relies only on the Kp index to predict the geographical extent of the auroral oval and generates visualizations only once a day, without accounting for temporal variations. The displayed map therefore represents the peak forecasted intensity during the event. OVATION-Prime was also checked on May 11 at 9 UT during high auroral electrojet activity Figure 8. The OVATION geomagnetic latitude boundary is comparable to the one at 22 h37 UT on May 10. When strictly considering IUAF data from 10 May 2024, the oval Southern boundary is equivalent to the other models.
7. Conclusion
We have used 97 cameras of the European FRIPON Network to observe the zenith intensity brightness and its evolution during the May 2024 Mother’s Day event. The analysis shows the real value of using this network to precisely map the evolution of the equatorward boundary of the auroral oval. Recent publications about this geomagnetic storm conclude the equivalent expansion to 40° N as shown by Karan et al. (2024) in South America and by Nanjo & Shiokawa (2024) in Japan. Our observations allow us to determine a latitudinal southern limit of the northern-hemisphere auroral oval at 46° N – 42° N (geographic – QD geomagnetic) latitude over Europe during this event. The FRIPON network provides the Space Weather community with a fine spatial and temporal resolution that cannot be achieved using existing Space Weather instruments in Europe.
This result is further south than that predicted by the OVATION models and Aurorasaurus, which predict the oval just down to 51°N – 47°N (geographic – QD geomagnetic) with a visibility line around 41°N at the lowest. Only the maps provided by the Geophysical Institute of the University of Alaska Fairbanks show an accurate spatial range, but with significant time uncertainty.
This work allowed us to compare the FRIPON observation with other instruments and datasets. The results are in accordance with the global VIIRS satellite imagery and Swarm field-aligned current observations during the storm. Although these satellite instruments were unable to observe the same locations frequently, making it impossible to observe Western Europe during the peak intensity, we can still observe the presence of aurorae as low as 42° N QD geomagnetic latitude at different longitudes in the northern as well as the southern hemisphere. The FRIPON observations were also linked with the variation seen in the GNSS TEC maps from Madrigal, horizontal field perturbations from magnetometers contributing to SuperMAG, where a noticeable increase to 40° N QD geomagnetic latitude was seen for both datasets as well. These results confirm the optical FRIPON observations. In addition, the FRIPON network observations lead to measure a faint but global increase in the brightness down to 37° N QD geomagnetic latitude. This likely corresponds to a Stable Aurora Red (SAR) arc across Europe, mainly around 40° and down to 37° N QD geomagnetic latitude during the highest activity. This confirms Spogli et al. (2024), who expected SAR arcs to be present based on their measurement of the ionospheric variability during this event. Our analysis also suggests a faint and diffuse auroral structure going as low as 37° N during the maximal activity, and staying around 41 to 43° N during a part of the European night.
This work validates the use of the FRIPON network for Space Weather research. This network allows the acquisition of useful data, complementary to the existing ones in Space Weather to help in the study of aurorae.
In the future, it will be interesting to compare other mid-latitude events (such as the 10 October 2024 geomagnetic storm) to determine if we get similar results. In addition, this all-sky camera network could help the Space Weather community determine how mid-latitude auroral structures evolve in relation to magnetic components more precisely.
Acknowledgments
We thank the FRIPON international team : France : François Colas, Brigitte Zanda, Pierre Vernazza, Adrien Malgoyre, Sylvain Bouley, Jérôme Gattaceca, Asma Steinhausser, Mirel Birlan, Jérémie Vaubaillon, Simon Jeanne, Lucie Maquet,/ Spain : Josep Maria Trigo-Rodriguez, Enrique Herrero/UK: Jim Rowe, Andrew Smedley, Ashley King/Italy: Daniele Gardiol, Dario Barghini/Netherlands : Sebastiaan de Vet, Detlef Koschny/Canada: Olivier Hernandez, Auriane Egal et Mathieu Forcier/Romania: Dan Alin Nedelcu M, irel Birlan, Simon Anghel/Germany: Björn Poppe/Belgium Hervé Lamy, Emmanuel Jehin/Andino: Sebastien Bouquillon, Katherine Vieira, Hebe Cremades, Rene A. Mendez, Andres Jordan Marocco: Chennaoui Hasnaa, Zouhair Benkhaldoun/Senegal: Salma Sylla. We acknowledge use of the SuperMAG ground magnetometer station data (http://supermag.jhuapl.edu/). Some results presented in this paper rely on data collected at magnetic observatories. We thank the national institutes that support them and INTERMAGNET for promoting high standards of magnetic observatory practice (https://www.intermagnet.org). We thank the Geophysical Institute of UAF and Aurorasaurus consortium for showing their data We thank Carlos Martinis, Steve Smith, the Boston University Imaging Science Team (https://sirius.bu.edu/) and the Asiago Astrophysical Observatory (University of Padua) for the availability of the 6300 Å and 5577 Å all sky camera images. The editor thanks two anonymous reviewers for their assistance in evaluating this paper.
Funding
FRIPON (https://www.FRIPON.org) is funded by the ANR grant N.13-BS05-0009-03, carried by the Paris Observatory (https://www.observatoiredeparis.psl.eu) Muséum National d’Histoire Naturelle (https://www.mnhn.fr) Paris-Saclay University (https://www.universite-paris-saclay.fr) and Pythéas institute (https://www.osupytheas.fr) (LAM https://www.lam.fr, CEREGE https://www.cerege.fr). Vigie-Ciel (https://www.vigie-ciel.org) is part of the 65 Millions d’Observateurs project, carried by the Muséum National d’Histoire Naturelle, funded by the French Investissements d’Avenir program. FRIPON data are hosted and processed at Institut Pythéas – IT department (SIP). A mirror is also hosted at LTE (https://www.lte.observatoiredeparis.psl.eu/) (Laboratoire Temps et Espace). We thank the Institut de Physique du Globe for supporting its operation and INTERMAGNET for ensuring high standards of magnetic observatory practice (www.intermagnet.org). We thank the Action Thématique Soleil Terre (ATST) for supporting this research.
Conflict of interest
The authors declare no Conflict of Interest.
Data availability statement
The real-time data (actually JPEG images taken every ten minutes at each station) are publicly available through FRIPON’s interface. Raw data (FITS files) and calibration data are available upon free registration. FRIPON’s policy is to limit data downloads on the server. When registering, the user is asked to provide the goal of the download. The FRIPON team is also keen to prepare data for users. The keograms show in Section 4.5 are available upon request to the first author. We acknowledge the Community Coordinated Modeling Center (CCMC) at Goddard Space Flight Center for the use of the Ovation-Prime model results. OVATION Prime was developed at Johns Hopkins Applied Physics Laboratory (JHU-APL) by Patrick Newell and co-workers. It can be accessed at https://ccmc.gsfc.nasa.gov/models/Ovation-Prime~2.3 GPS TEC data products and access through the Madrigal distributed data system are provided to the community (http://www.openmadrigal.org) by the Massachusetts Institute of Technology (MIT) under support from US National Science Foundation grant AGS-2504079. Data for TEC processing is provided by the following organizations: UNAVCO, Scripps Orbit and Permanent Array Center, Institut Geographique National, France, International GNSS Service, The Crustal Dynamics Data Information System (CDDIS), National Geodetic Survey, Instituto Brasileiro de Geografia e Estatística, RAMSAC CORS of Instituto Geográfico Nacional de la República Argentina, Arecibo Observatory, Low-Latitude Ionospheric Sensor Network (LISN), Topcon Positioning Systems, Inc., Canadian High Arctic Ionospheric Network, Centro di Ricerche Sismologiche, Systéme d’Observation du Niveau des Eaux Littorales (SONEL), RENAG : REseau NAtional GPS permanent, GeoNet – the official source of geological hazard information for New Zealand, GNSS Reference Networks, Finnish Meteorological Institute, and SWEPOS – Sweden. Access to these data is provided by madrigal network via: http://cedar.openmadrigal.org/.
Supplementary material
The movie FRIPON_supermag_2.mp4 shows the magnetic data and the equivalent current from SuperMAG network and the optical FRIPON intensities. Please see Section 2.4 for details. Access Supplementary Material
The movie FRIPON_madrigaltec_viirs_swarm_slow.mp4 shows a full comparison over the night of SWARM, VIIRS, the TEC and FRIPON. See Section 4 for details. Access Supplementary Material
References
- Alekseev VN and Ievenko IB. 2008. SAR arc occurrence frequency during cycle 23 of solar activity. Geomag Aeron 48(4):446–449. https://doi.org/10.1134/S001679320804004X. [Google Scholar]
- Baatar, N, Tsegmed B, Li L, and Leghari GM. 2023. Differences in the response to CME and CIR drivers of geomagnetic disturbances. Solnechno-Zemnaya Fizika 9:35–40. https://doi.org/10.12737/szf-92202304. [Google Scholar]
- Bessell MS. 2000. The Hipparcos and tycho photometric system passbands. Publ Astron Soc Pac 112(773):961–965. https://doi.org/10.1086/316598. [Google Scholar]
- Campuzano SA, Delgado-Gómez F, Migoya-Orué Y, Rodríguez-Caderot G, Herraiz-Sarachaga M, Radicella SM, 2023. Study of ionosphere irregularities over the Iberian Peninsula during two moderate geomagnetic storms using gnss and ionosonde observations. Atmosphere 14(2):233. https://doi.org/10.3390/atmos14020233. [CrossRef] [Google Scholar]
- Case, NA, MacDonald EA, and Viereck, R. 2016. Using citizen science reports to define the equatorial extent of auroral visibility. Space Weather 14:198–209. https://doi.org/10.1002/2015SW001320. [Google Scholar]
- Colas F, Zanda B, Bouley S, Jeanne S, Malgoyre A, et al., 2020. FRIPON: a worldwide network to track incoming meteoroids. Astron Astrophys 644:A53. https://doi.org/10.1051/0004-6361/202038649. [Google Scholar]
- Foster JC, Erickson PJ, Nishimura Y, Zhang SR, Bush DC, Coster AJ, Meade PE, and Franco-Diaz E. 2024. Imaging the May 2024 extreme aurora with ionospheric total electron content. Geophys Res Lett 51(20):e2024GL111. https://doi.org/10.1029/2024GL111981. [Google Scholar]
- Gjerloev JW. 2012. The SuperMAG data processing technique. J Geophys Res Space Phys 117(A9):A09213. https://doi.org/10.1029/2012JA017683, https://agupubs.onlinelibrary.wiley.com/doi/abs/10.1029/2012JA017683. [Google Scholar]
- Grandin M, Bruus E, Ledvina VE, Partamies N, Barthelemy M, et al. 2024. The Gannon Storm: citizen science observations during the geomagnetic superstorm of 10 May 2024. Geosci Commun 7(4):297–316. https://doi.org/10.5194/gc-7-297-2024. [Google Scholar]
- Hajra R, Tsurutani BT, Lakhina GS, Lu Q, and Du A. 2024. Interplanetary causes and impacts of the 2024 May superstorm on the geosphere: An overview. Astrophys J, 974(2):264. https://doi.org/10.3847/1538-4357/ad7462, https://iopscience.iop.org/article/10.3847/1538-4357/ad7462. [Google Scholar]
- Hayakawa H, Ebihara Y, Mishev A, Koldobskiy S, Kusano K. et al. 2025. The solar and geomagnetic storms in 2024 May: A flash data report. Astrophys J 979(1):49. https://doi.org/10.3847/1538-4357/ad9335. [Google Scholar]
- Jeanne S, Colas F, Zanda B, Birlan M, Vaubaillon J, et al. 2019. Calibration of fish-eye lens and error estimation on fireball trajectories: application to the FRIPON network. Astron Astrophys 627:A78. https://doi.org/10.1051/0004-6361/201834990. [Google Scholar]
- Karan DK, Martinis CR, Daniell RE, Eastes RW, Wang W, McClintock WE, Michell RG, and England SL. 2024. GOLD observations of the merging of the southern crest of the equatorial ionization anomaly and aurora during the 10 and 11 May 2024 Mother’s Day super geomagnetic storm. Geophys Res Lett 51(15):e2024GL110–632. https://doi.org/10.1029/2024GL110632. [Google Scholar]
- Koloskov O, Kashcheyev A, Bogomaz O, Sopin A, Gavrylyuk B, and Zalizovski A. 2023. Performance analysis of a portable low-cost SDR-based ionosonde. Atmosphere 14(1):159. https://doi.org/10.3390/atmos14010159. [Google Scholar]
- Kudin DV, Soloviev AA, Sidorov RV, Starostenko VI, Sumaruk YP, and Legostaeva OV. 2021. Advanced production of quasi-definitive magnetic observatory data of the INTERMAGNET standard. Geomag Aeron 61(1):54–67. https://doi.org/10.1134/S0016793221010096. [Google Scholar]
- Kwak YS, Kim JH, Kim S, Miyashita Y, Yang T, et al. 2024. Observational overview of the May 2024 G5-level geomagnetic storm: From solar eruptions to terrestrial consequences. J Astron Space Sci 41(3):171–194. https://doi.org/10.5140/JASS.2024.41.3.171. [Google Scholar]
- Liu J, Wang W, Liang J, Liu L, Martinis C, Wroten J, Zhang Y, Chen Y, Cao T, and Lu Y. 2025. Redefining SAR Arc Generation: The competing roles of magnetospheric and ionospheric energy injection. AGU Adv 6(6):e2025AV001–881. https://doi.org/10.1029/2025AV001881, https://agupubs.onlinelibrary.wiley.com/doi/abs/10.1029/2025AV001881. [Google Scholar]
- MacDonald E, Case N, Clayton J, Hall M, Heavner M, Lalone N, Patel K, and Tapia A. 2015. Aurorasaurus: A citizen science platform for viewing and reporting the aurora. Space weather 13(9):548–559. https://doi.org/10.1002/2015SW001214. [Google Scholar]
- Machol JL, Green JC, Redmon RJ, Viereck RA and Newell PT. 2012. Evaluation of OVATION Prime as a forecast model for visible aurorae. Space Weather 10(3):00746. https://doi.org/10.1029/2011SW000746. [Google Scholar]
- Maier EJ, Chandra S, Brace L, Hoffman JH, Shepherd GG, and Whitteker JH. 1975. The SAR arc event observed during the December 1971 magnetic storm. J Geophys Res 80:4591–4597. https://doi.org/10.1029/JA080i034p04591, http://earthref.org/ERR/25068/. [Google Scholar]
- Martinis C, Griffin I, Gallardo-Lacourt B, Wroten J, Nishimura Y, Baumgardner J, and Knudsen DJ. 2022. Rainbow of the Night: First Direct Observation of a SAR Arc Evolving Into STEVE. Geophys Res Lett 49(11):e2022GL098,511 E2022GL098511 2022GL098511. https://doi.org/10.1029/2022GL098511, https://agupubs.onlinelibrary.wiley.com/doi/abs/10.1029/2022GL098511. [Google Scholar]
- Miller S, Straka W, Mills S, Elvidge C, Lee T, Solbrig J, Walther A, Heidinger A, and Weiss S. 2013. Illuminating the capabilities of the Suomi national polar-orbiting partnership (NPP) visible infrared imaging radiometer suite (VIIRS) day/night band. Remote Sens 5(12):6717–6766. https://doi.org/10.3390/rs5126717, https://www.mdpi.com/2072-4292/5/12/6717. [Google Scholar]
- Mouikis CG, Bingham ST, Kistler LM, Farrugia CJ, Spence HE, Reeves GD, Gkioulidou M, Mitchell DG, and Kletzing CA. 2019. The storm-time ring current response to ICMEs and CIRs using van allen probe observations. J Geophys Res (Space Phys), 124(11):9017–9039. https://doi.org/10.1029/2019JA026695. [Google Scholar]
- Nagy AF, Roble RG, and Hays PB. 1970. Stable mid-latitude red arcs: Observations and theory. 11(5):709–727. https://doi.org/10.1007/BF00177029. [Google Scholar]
- Nanjo S, and Shiokawa K. 2024. Spatial structures of blue low-latitude aurora observed from Japan during the extreme geomagnetic storm of May 2024. Earth Planets Space 76(1):156. https://doi.org/10.1186/s40623-024-02090-9. [CrossRef] [Google Scholar]
- Newell PT, and Gjerloev JW. 2011. Evaluation of SuperMAG auroral electrojet indices as indicators of substorms and auroral power. J Geophys Res Space Phys 116(A12):2011JA016,779. https://doi.org/10.1029/2011JA016779, https://onlinelibrary.wiley.com/doi/10.1029/2011JA016779. [Google Scholar]
- Newell PT, and Gjerloev JW. 2012. SuperMAG?based partial ring current indices. J Geophys Res Space Phys 117(A5):2012JA017,586. https://doi.org/10.1029/2012JA017586, https://agupubs.onlinelibrary.wiley.com/doi/10.1029/2012JA017586. [Google Scholar]
- Pi X, Mannucci AJ, Lindqwister UJ, and Ho CM, 1997. Monitoring of global ionospheric irregularities using the Worldwide GPS Network. Geophys Res Lett 24(18):2283–2286. https://doi.org/10.1029/97GL02273, http://doi.wiley.com/10.1029/97GL02273. [Google Scholar]
- Qu BH, Lu JY, Wang ZW, Liu JJ, Wang M, Li JY, and Zhang H. 2024. Different origin field-aligned currents and their relationship with auroral intensity. J Geophys Res (Space Phys) 129(10):e2024JA032927. https://doi.org/10.1029/2024JA032927. [Google Scholar]
- Rees MH, and Akasofu SI. 1962. On the association between subvisual red arcs and the dst (H) decrease. Planet Space Sci 11:105–107. https://doi.org/10.1016/0032-0633(63)90225-3, https://www.osti.gov/biblio/4729413. [Google Scholar]
- Rideout W, and Coster A. 2006. Automated GPS processing for global total electron content data. GPS Solutions 10(3):219–228. https://doi.org/10.1007/s10291-006-0029-5, http://link.springer.com/10.1007/s10291-006-0029-5. [Google Scholar]
- Ritter P, Lühr H, and Rauberg J. 2013. Determining field-aligned currents with the Swarm constellation mission. Earth Planets Space 65(11):9–1294. https://doi.org/10.5047/eps.2013.09.006, http://link.springer.com/article/10.5047/eps.2013.09.006. [Google Scholar]
- Spogli L, Alberti T, Bagiacchi P, Cafarella L, Cesaroni C, et al. 2024. The effects of the May 2024 Mother’s Day superstorm over the Mediterranean sector: from data to public communication. Ann Geophys 67:218, essoar.171804431. https://doi.org/10.4401/ag-9117. [Google Scholar]
- Vierinen J, Coster AJ, Rideout WC, Erickson PJ, and Norberg J. 2015. Statistical Framework for Estimating GNSS Bias. https://doi.org/10.5194/amtd-8-9373-2015, https://amt.copernicus.org/articles/9/1303/2016/amt-9-1303-2016-discussion.html. [Google Scholar]
- Wang W, Lei J, Burns AG, Solomon SC, Wiltberger M, Xu J, Zhang Y, Paxton L, and Coster A. 2010. Ionospheric response to the initial phase of geomagnetic storms: Common features. J Geophys Res Space Phys, 115(A7):2009JA014,461. https://doi.org/10.1029/2009JA014461, https://agupubs.onlinelibrary.wiley.com/doi/10.1029/2009JA014461. [Google Scholar]
- Xiong C, Stolle C, Alken P, and Rauberg J. 2020. Relationship between large-scale ionospheric field-aligned currents and electron/ion precipitations: DMSP observations. Earth Planets Space 72(1):147. https://doi.org/10.1186/s40623-020-01286-z, https://earth-planets-space.springeropen.com/articles/10.1186/s40623-020-01286-z. [Google Scholar]
From Astronomical Institute of Canary island, https://iac.edu.es/es/blog/vialactea/2024/05/auroras-boreales-desde-canarias (last visit on 2025 October 3th).
https://www.gi.alaska.edu/monitors/aurora-forecast, last updated: 2025-10-13.
Cite this article as: Katz O, Lilensten J, Doornbos E, Colas F, and the FRIPON International Team, Pizarro A, Falque B. 2024. Equatorward expansion of the auroral oval during the May 2024 geomagnetic storm observed over Europe by FRIPON all-sky cameras and satellites. J. Space Weather Space Clim. 16, 15. https://doi.org/10.1051/swsc/2026011.
All Tables
Quasi Dipole geomagnetic coordinates (in degrees) of the INTERMAGNET magnetometers used in this study. Column one: full name, country. Column 2: Acronym. Column 3: Magnetic latitude. Column 4: Quasi Dipole geomagnetic longitude.
All Figures
|
Figure 1. Upper panel: The referenced station localisation of the FRIPON network over Europe and the World on April 2025 (OpenStreetMap/FRIPON). Lower panel: Evolution of the auroral structure over Longville-in-the-Dale (England, 52° 32′ 21′′ N, –2° 40′ 51′′W) from 22:02 UTC to 22:22 UTC on 10 May. In this figure, the 3 pictures are uncalibrated and unprocessed (northward direction at the bottom of the images). |
| In the text | |
|
Figure 2. Map of the data acquisition locations. White circles markers represent FRIPON all-sky cameras, black diamonds markers are stations that have provided SuperMAG ground magnetometer data and satellite ground-tracks annotated with the flight directions, the satellite names and UTC times of the start and end of the pass through the map area. Lines of constant quasi-dipole magnetic latitude have been added in gray and annotated on the inside of the frame. |
| In the text | |
|
Figure 3. Relative locations of the Low Earth Orbiting satellites NOAA-21, Swarm A and B at 23:38 UTC on 10 May 2024. The orientations of the orbital planes and day-night boundary in this image are nearly constant during the interval of the storm. |
| In the text | |
|
Figure 4. Global indicators of the progression of the storm from SuperMAG ground magnetometer indices and polar satellite data. Time in UTC. |
| In the text | |
|
Figure 5. Sequence of maps showing FRIPON (circles) and SuperMAG (diamonds with vector arrows) observations on 10 May 2024 White lines indicate QD magnetic latitudes, all time stamps refer to UTC, and relative FRIPON brightness refer to the respective values at 21:40 UTC. |
| In the text | |
|
Figure 6. Blue line: Total local magnetic field intensity (nT) at stations HLP, BEL and THY (please refer to Table 1 for details). Orange: Comparison with the closest FRIPON camera at zenith (mag arcsec−2). The Quasi Dipole geomagnetic latitudes are given in the legend. |
| In the text | |
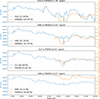 |
Figure 7. Same as Figure 6 at stations ESK, HAD, CLF and EBR. |
| In the text | |
|
Figure 8. FRIPON zenith observations (panel a) compared with other indicators of auroral latitudes: total electron content (panel b) and magnetic field perturbations (panel c). The time is shown in UTC. |
| In the text | |
|
Figure 9. Sequence of maps showing FRIPON observations (circles) on 10 May 2024 in context with total electron content maps, Swarm field-aligned currents and VIIRS-DNB night-time imagery. |
| In the text | |
|
Figure 10. Auroral pillars seen at zenith by the Besançon detector (47° 14′ 48′′ N, 5° 59′ 21′′ W). Northward direction at the bottom of the images. |
| In the text | |
|
Figure 11. Keogram from the Besançon detector at 42.227° N Quasi Dipole geomagnetic (47° 14′ 48′′ N, 5° 59′ 21′′ W). The dashed line represents the zenith. |
| In the text | |
|
Figure 12. Different captures showing very faint homogeneous aurorae over zenith. The first one during the peak of activities, the 3 other show a stable arc afterwards. Coordinates are quasi-dipole geomagnetic. Northward direction at the bottom of the images. |
| In the text | |
|
Figure 13. Different captures showing 630 nm – red (first 3 captures) and 557,7 nm – green (last capture). |
| In the text | |
|
Figure 14. Left panel: OVATION Prime model projected using the NASA Community Coordinated Modeling Center et 22:36 UTC. Middle panel: aurorasaurus at 22:45 UTC. Right panel: Geophysical institute of the University of Alaska Fairbanks model on 11 May 2024. |
| In the text | |
Current usage metrics show cumulative count of Article Views (full-text article views including HTML views, PDF and ePub downloads, according to the available data) and Abstracts Views on Vision4Press platform.
Data correspond to usage on the plateform after 2015. The current usage metrics is available 48-96 hours after online publication and is updated daily on week days.
Initial download of the metrics may take a while.