Figure 2.
Download original image
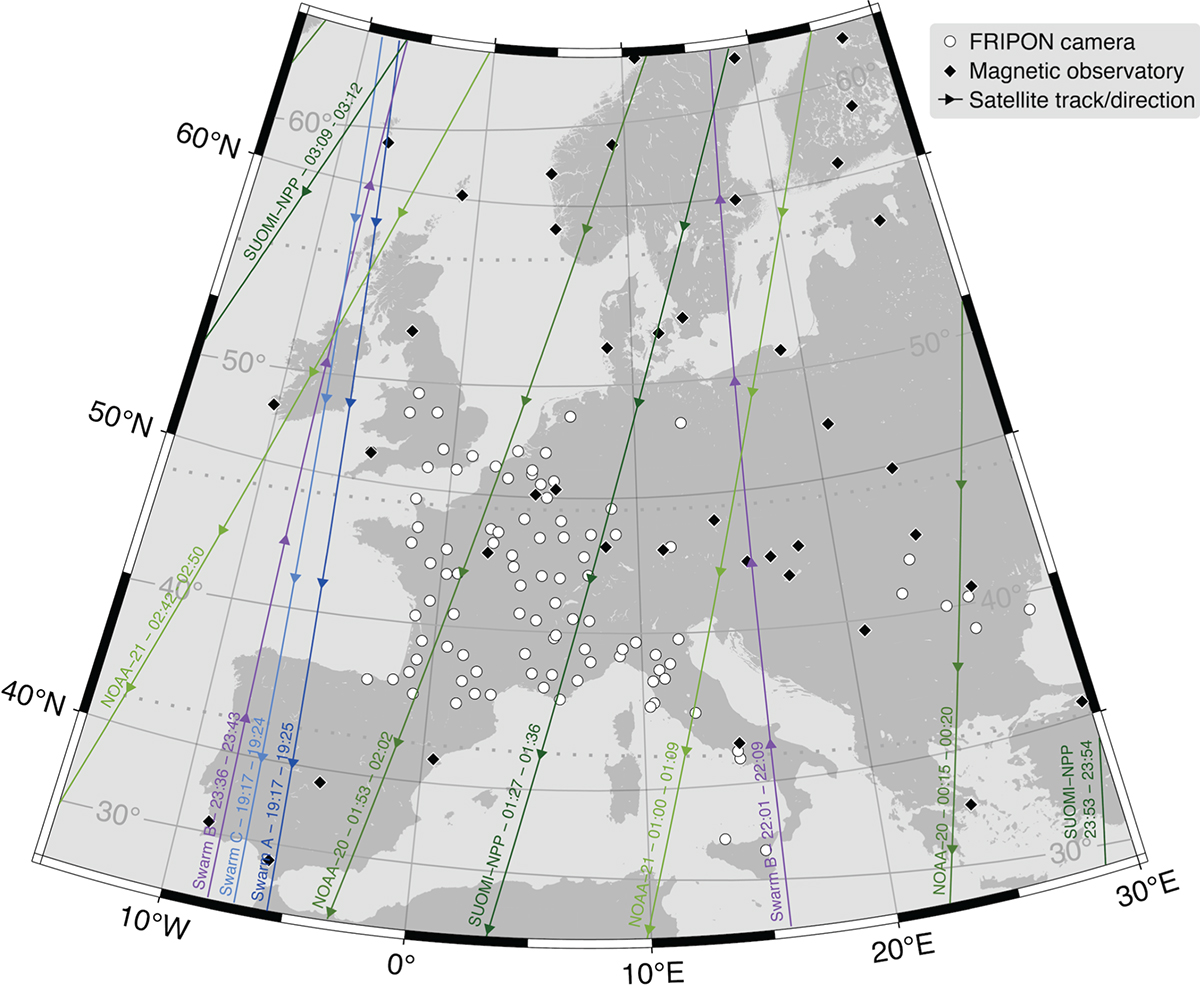
Map of the data acquisition locations. White circles markers represent FRIPON all-sky cameras, black diamonds markers are stations that have provided SuperMAG ground magnetometer data and satellite ground-tracks annotated with the flight directions, the satellite names and UTC times of the start and end of the pass through the map area. Lines of constant quasi-dipole magnetic latitude have been added in gray and annotated on the inside of the frame.
Current usage metrics show cumulative count of Article Views (full-text article views including HTML views, PDF and ePub downloads, according to the available data) and Abstracts Views on Vision4Press platform.
Data correspond to usage on the plateform after 2015. The current usage metrics is available 48-96 hours after online publication and is updated daily on week days.
Initial download of the metrics may take a while.