Figure 6
Download original image
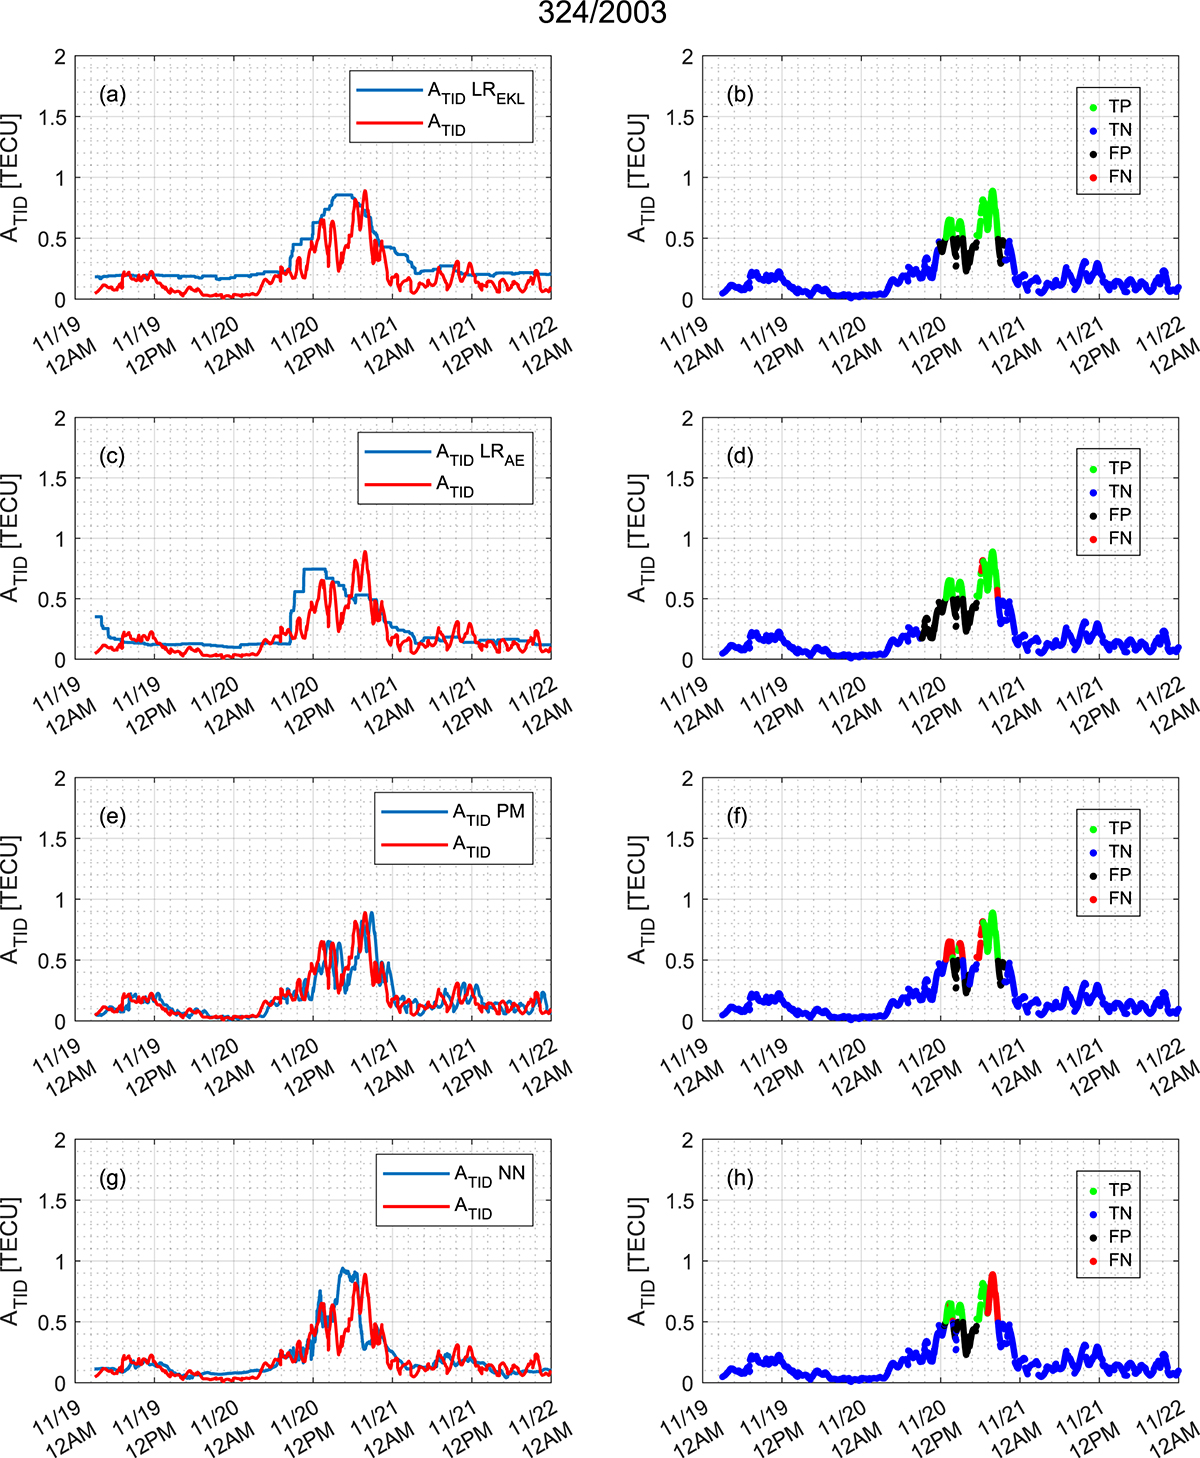
Left panels: One-hour prediction of the TID activity index during the geomagnetic storm event registered on the 20th of November 2003 using: (a) LREKL, (c) LRAE, (e) PM and (g) NN model. Right panels: The same predictions presented in the left panel, but evaluated as a classification problem, showing True Positives (TP), True Negatives (TN), False Positives (FP) and False Negatives (FN) for a threshold of 0.5 TECU obtained using: (b) LREKL, (d) LRAE, (f) PM and (h) NN model.
Current usage metrics show cumulative count of Article Views (full-text article views including HTML views, PDF and ePub downloads, according to the available data) and Abstracts Views on Vision4Press platform.
Data correspond to usage on the plateform after 2015. The current usage metrics is available 48-96 hours after online publication and is updated daily on week days.
Initial download of the metrics may take a while.