Open Access
Figure 4
Download original image
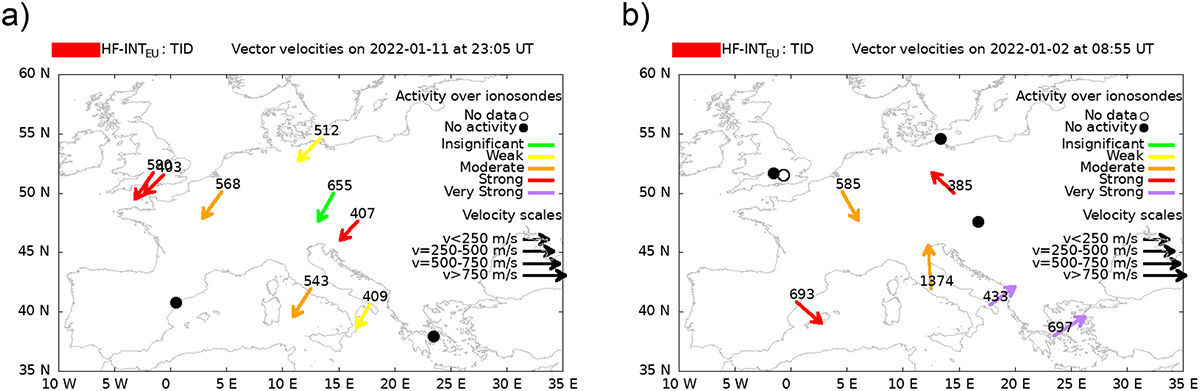
Two timestamps of HF-INT results for two different periods with high HF-INTEU values. In both cases, the maps show the same behavior during 3 h for the event on the left, and during 2.5 h for the event on the right. Arrows indicate propagation azimuth, with numbers representing velocity in m/s.
Current usage metrics show cumulative count of Article Views (full-text article views including HTML views, PDF and ePub downloads, according to the available data) and Abstracts Views on Vision4Press platform.
Data correspond to usage on the plateform after 2015. The current usage metrics is available 48-96 hours after online publication and is updated daily on week days.
Initial download of the metrics may take a while.