Figure 1
Download original image
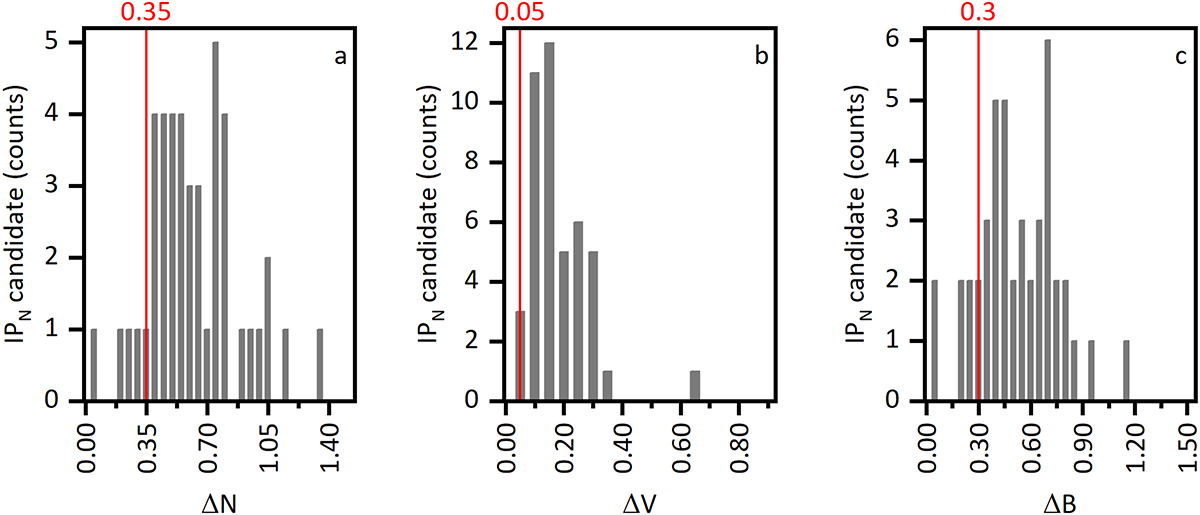
Dependence of the shock wave candidate counts (left vertical axis in all the panels) on the relative changes in the SW N, ΔN (a); V, ΔV (b); and IMF, ΔB (c). The red vertical lines represent the selected thresholds for identifying the shock waves: 0.35, 0.05, and 0.30 for ΔN, ΔV, and ΔB, respectively.
Current usage metrics show cumulative count of Article Views (full-text article views including HTML views, PDF and ePub downloads, according to the available data) and Abstracts Views on Vision4Press platform.
Data correspond to usage on the plateform after 2015. The current usage metrics is available 48-96 hours after online publication and is updated daily on week days.
Initial download of the metrics may take a while.