Figure 6
Download original image
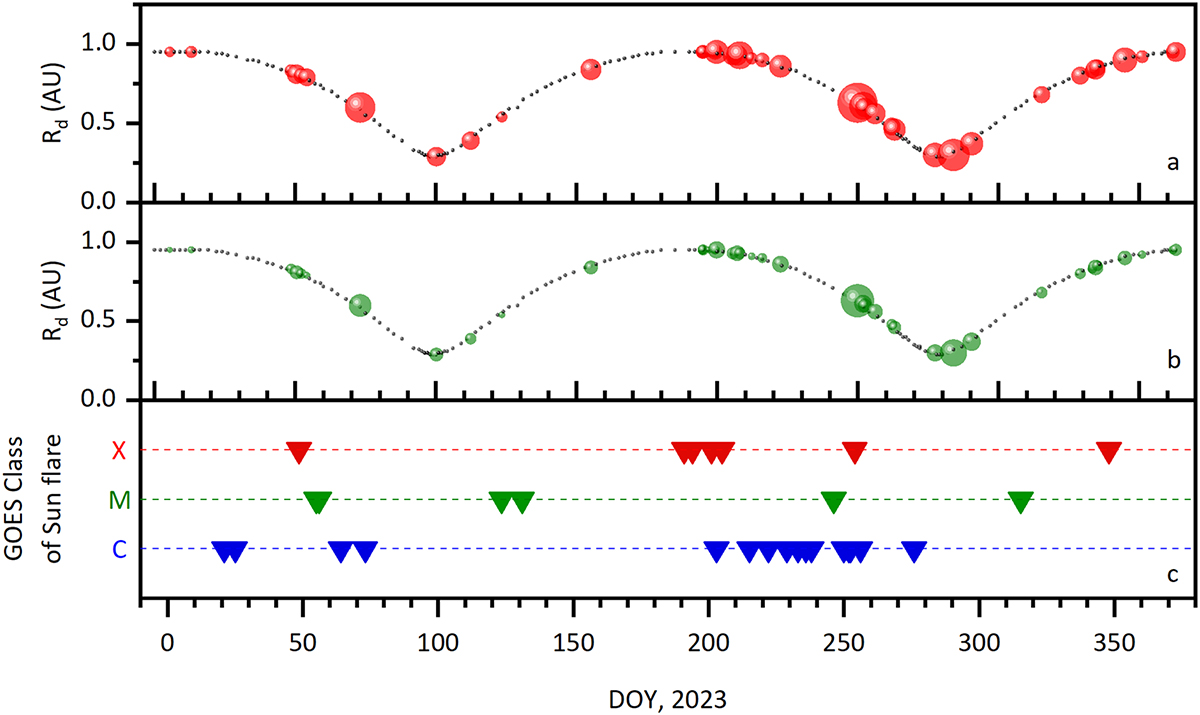
Distributions of the shock waves recorded by the SWA-PAS and MAG instruments in 2023 along the SolO trajectory compared with the X-, M-, and C-class solar flares obtained from the STIX Data Center. The dark dots in panels a and b indicate the daily average (UTC ≈ 12:00) spacecraft location according to the Solar-MACH catalog (https://solar-mach.github.io), with a time step of 1–5 days. The top panel shows the moments of registering the shock waves for QF1 in the form of spheres of different diameters; the middle panel displays the same information as Panel a, but for QF2. The diameters of the spheres were proportional to the QF1 and QF2 values listed in Table A1. Panel c shows the time points at which different-class X-ray flares were recorded.
Current usage metrics show cumulative count of Article Views (full-text article views including HTML views, PDF and ePub downloads, according to the available data) and Abstracts Views on Vision4Press platform.
Data correspond to usage on the plateform after 2015. The current usage metrics is available 48-96 hours after online publication and is updated daily on week days.
Initial download of the metrics may take a while.