Figure 2
Download original image
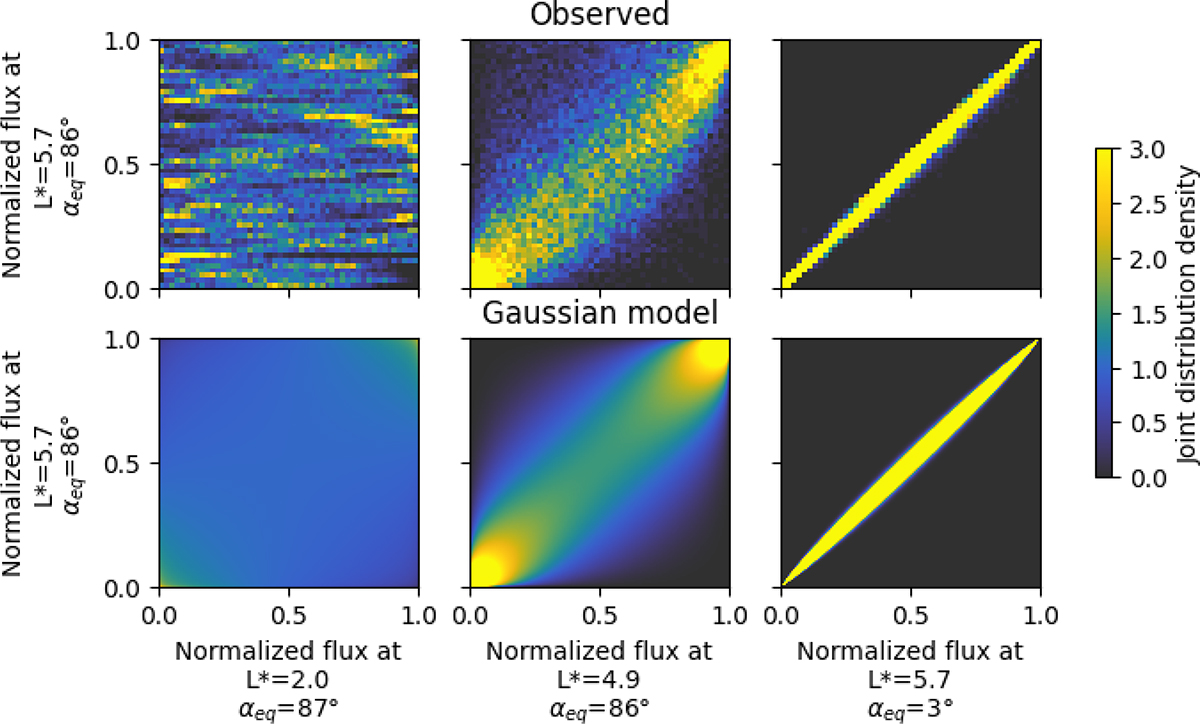
Joint distributions of the normalized 1MeV FEDO at L* = 5.7 and αeq = 86° and at different points of the domain (the coordinates of each point are presented at the bottom of each column). The top row shows the empirical joint probability distribution density, and the bottom row presents the corresponding probability density of a fitted Gaussian copula.
Current usage metrics show cumulative count of Article Views (full-text article views including HTML views, PDF and ePub downloads, according to the available data) and Abstracts Views on Vision4Press platform.
Data correspond to usage on the plateform after 2015. The current usage metrics is available 48-96 hours after online publication and is updated daily on week days.
Initial download of the metrics may take a while.