Figure 4
Download original image
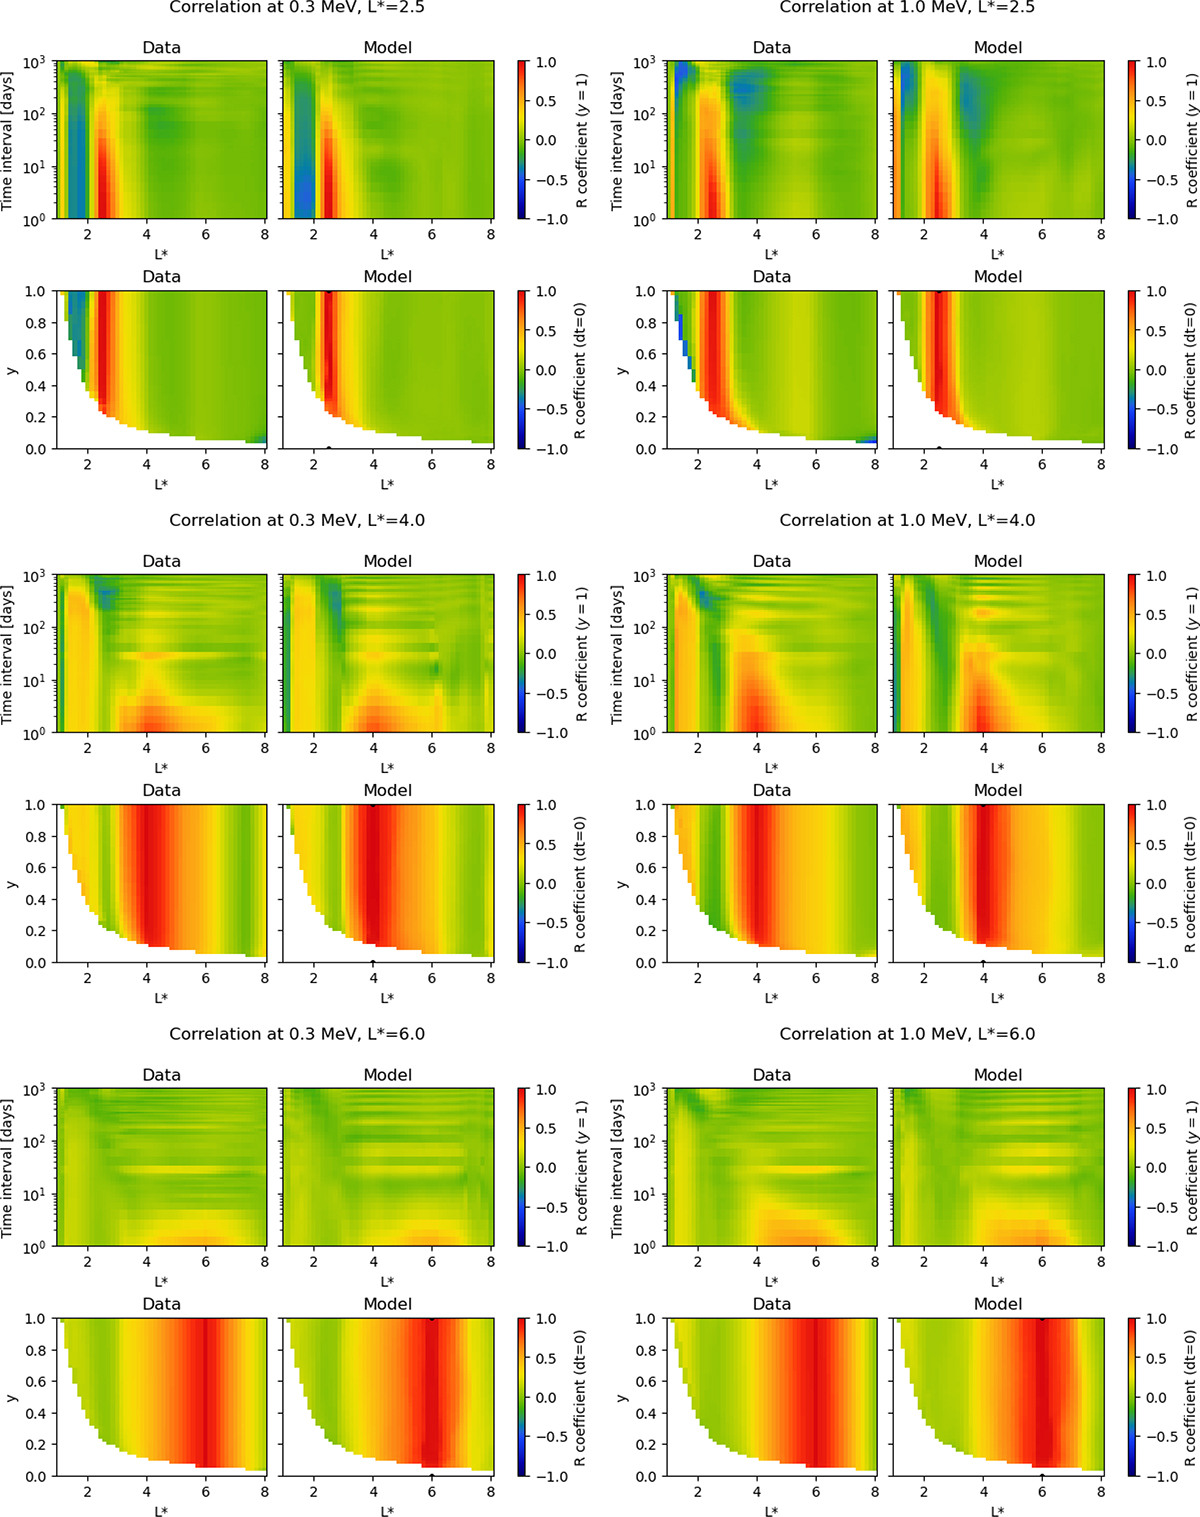
Observed and modelled correlation coefficient for normalized electron fluxes. Each group of four plots represents the correlation coefficient for the equatorial fluxes at a given L* and energy with all equatorial points at the same energy as a function of L* and time interval (top plots) and with all points at the same energy with no time interval as a function of L* and y (bottom plots).
Current usage metrics show cumulative count of Article Views (full-text article views including HTML views, PDF and ePub downloads, according to the available data) and Abstracts Views on Vision4Press platform.
Data correspond to usage on the plateform after 2015. The current usage metrics is available 48-96 hours after online publication and is updated daily on week days.
Initial download of the metrics may take a while.