Figure 5
Download original image
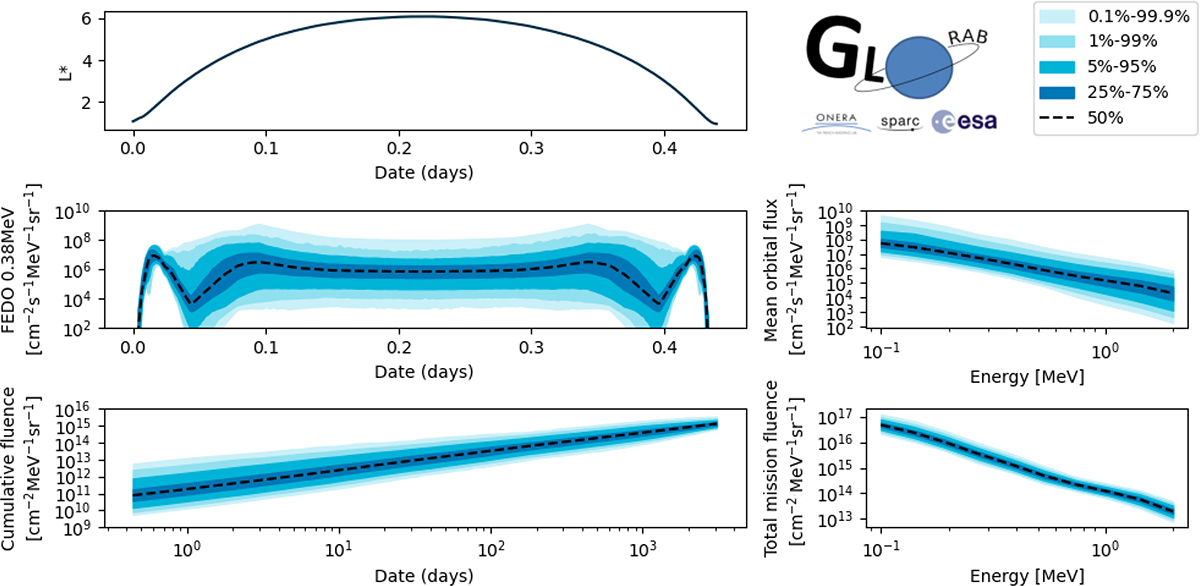
GLORAB model results overview for the Arase orbit. The top panel presents the L* coordinate of the satellite along its orbit. The left panels present the predicted distributions at 380 keV for the instantaneous fluxes along the trajectory (at the centre) and the cumulative distributions along the mission (at the bottom). The panels on the right present the mean orbital (at the centre) and total mission fluence (at the bottom) distributions as a function of the energy.
Current usage metrics show cumulative count of Article Views (full-text article views including HTML views, PDF and ePub downloads, according to the available data) and Abstracts Views on Vision4Press platform.
Data correspond to usage on the plateform after 2015. The current usage metrics is available 48-96 hours after online publication and is updated daily on week days.
Initial download of the metrics may take a while.