Open Access
Figure 6
Download original image
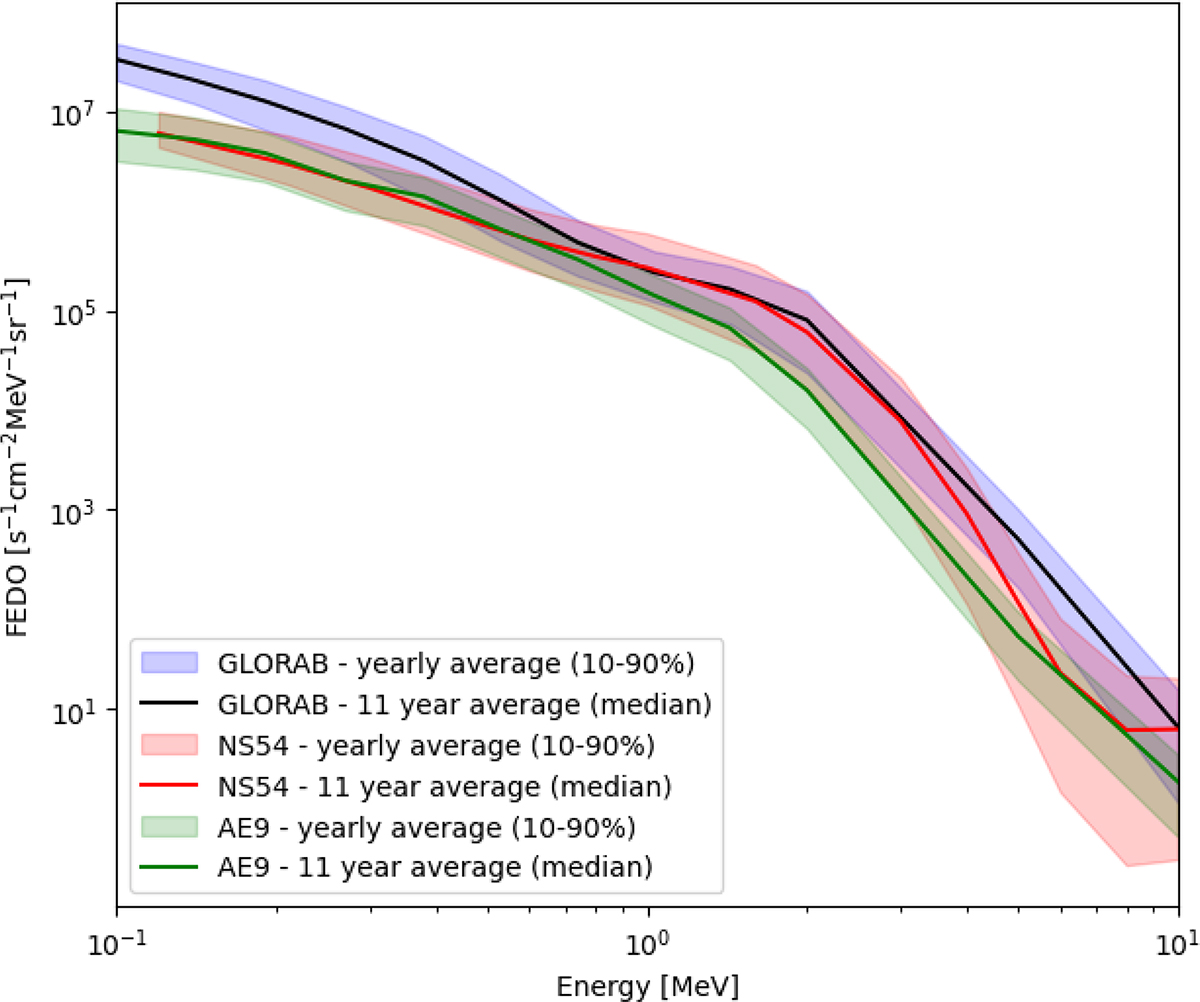
Yearly averages distribution and median 11-year average for the electron fluxes along the NS54 trajectory. The blue curves present our model results, the red curves the CXD2R observations, and the green curves the AE9 results.
Current usage metrics show cumulative count of Article Views (full-text article views including HTML views, PDF and ePub downloads, according to the available data) and Abstracts Views on Vision4Press platform.
Data correspond to usage on the plateform after 2015. The current usage metrics is available 48-96 hours after online publication and is updated daily on week days.
Initial download of the metrics may take a while.