Figure 15
Download original image
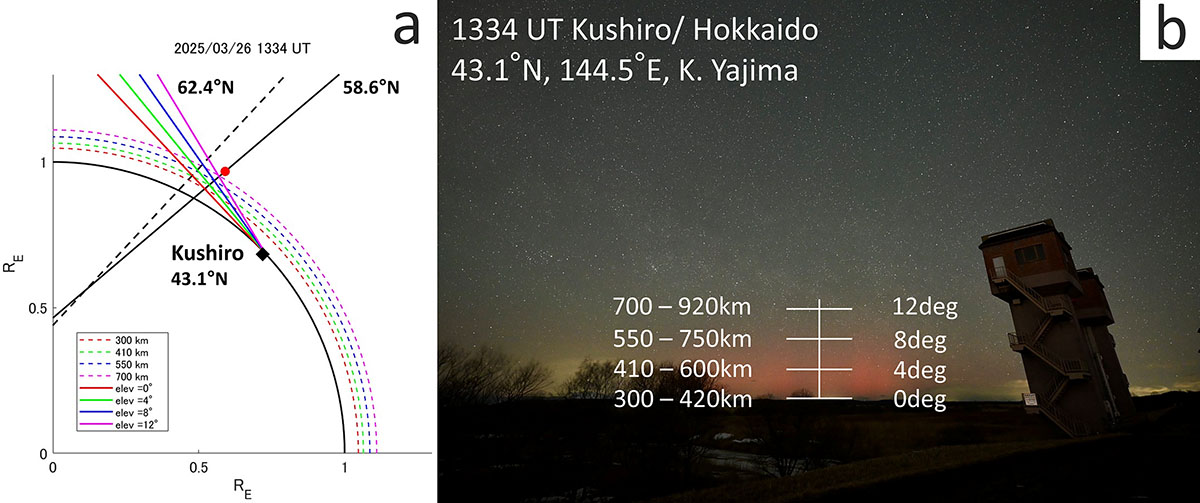
The estimation of auroral altitude of March 26, 2025 event. (a) The magnetic field line of the NOAA18 satellite’s location (red marker) is shown by black solid line. Black dotted line is the magnetic field line at 62.4°N derived from MetOp3 satellite. The black marker is the location of the observation. The lines-of-sight of 0-, 4-, 8-, 12-degree elevation angles are shown by red, green, blue, magenta solid lines. Each estimated altitude is indicated by the corresponding dotted curve, with altitudes of 300 km, 410 km, 550 km, and 700 km. (b) The resulting auroral altitude was visualized by superimposing an altitude grid on the photograph.
Current usage metrics show cumulative count of Article Views (full-text article views including HTML views, PDF and ePub downloads, according to the available data) and Abstracts Views on Vision4Press platform.
Data correspond to usage on the plateform after 2015. The current usage metrics is available 48-96 hours after online publication and is updated daily on week days.
Initial download of the metrics may take a while.