| Issue |
J. Space Weather Space Clim.
Volume 16, 2026
|
|
|---|---|---|
| Article Number | 19 | |
| Number of page(s) | 19 | |
| DOI | https://doi.org/10.1051/swsc/2026004 | |
| Published online | 19 May 2026 | |
Supplementary material
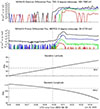 |
Figure S1. NOAA18 satellite TED and MEPED data across the auroral oval for the time interval from 1448 UT to 1452 UT, June 28, 2024. The energies of TED electron differential fluxes are 189, 844, 2,595, and 7,980 eV as colored by black, blue, green, and red, respectively. The energies of MEPED proton differential fluxes are 39, 115, 332, 1105, and 2723 keV as colored by black, blue, green, red and yellow, respectively. NOAA18 was located at near Japan’s meridian, i.e. 50–64°N and 108–99°E at that time. We identified the location where the flux of 189 eV electron (black line) exceeds 103 /cm2-s-sr-eV level as the equatorward boundary of the auroral oval. In this case, the timing is 1450 UT, and the geographic coordinate is 56.6°N, 104.2°E. |
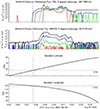 |
Figure S2. NOAA18 satellite TED and MEPED data across the auroral oval for the time interval from 1345 UT to 1350 UT, August 4, 2024. The energies of TED electron differential fluxes are 189, 844, 2,595, and 7,980 eV as colored by black, blue, green, and red, respectively. The energies of MEPED proton differential fluxes are 39, 115, 332, 1105, and 2723 keV as colored by black, blue, green, red and yellow, respectively. NOAA18 satellite was located at near Japan’s meridian, i.e. 48–65°N and 124–113°E at that time. We identified the location where the flux of 189 eV electron (black line) exceeds 103 /cm2-s-sr-eV level as the equatorward boundary of the auroral oval. In this case, the timing is 1348 UT, and the geographic coordinate is 57.9°N, 119.2°E. |
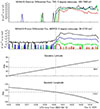 |
Figure S3. NOAA18 satellite TED and MEPED data across the auroral oval for the time interval from 1358UT to 1402 UT, September 12, 2024. The energies of TED electron differential fluxes are 189, 844, 2,595, and 7,980 eV as colored by black, blue, green, and red, respectively. The energies of MEPED proton differential fluxes are 39, 115, 332, 1105, and 2723 keV as colored by black, blue, green, red and yellow, respectively. NOAA18 satellite was located at near Japan’s meridian, i.e. 50–64°N and 120–112°E at that time. We identified the location where the flux of 189 eV electron (black line) exceeds 103 /cm2-s-sr-eV level as the equatorward boundary of the auroral oval. In this case, the timing is 1400 UT, and the geographic coordinate is 58.0°N, 116.3°E. |
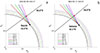 |
Figure S4. Workflow for the altitude estimation of the auroral upper edge for the June 28 and September 12 events. The magnetic field line at the location of the NOAA-18 satellite (red marker) is shown as a black solid line, while the black marker indicates the location of the observation site. The elevation angles of the auroral body were derived from photographs using stars as reference points and then projected onto the magnetic field line at the equatorward boundary of the auroral oval, as estimated from satellite data. (a) For the June 28, 2024, event observed from Yoichi (43.3°N), the lines of sight for elevation angles of 0°, 7°, 14°, and 21° are shown as red, green, blue, and magenta solid lines, respectively. Each estimated altitude is indicated by the corresponding dotted curve, with altitudes of 210 km, 410 km, 650 km, and 840 km. (b) For the September 12, 2024, event observed from Setana (42.5°N), the lines of sight for elevation angles of 0°, 5°, 10°, and 15° are shown as red, green, blue, and magenta solid lines, respectively. Each estimated altitude is indicated by the corresponding dotted curve, with altitudes of 290 km, 470 km, 630 km, and 800 km. |
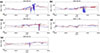 |
Figure S5. GSM Z-component of the GOES magnetometer for magnetic storm events associated with red auroras in 2024. The red lines are from GOES18, while the blue lines are fom GOES16. (a) GMC events occurred on 1407UT to 1426UT, and 1540UT to 1616UT at GOES 16. (b) GMC events occurred on 1520UT to 1645UT at GOES 16. (c) GMC occurred intermittently on 1833UT to 1918UT at GOES 16 and GOES 18. (d) GMC was not observed on November 9 event. (e) GMC events intermittently occurred on 1332 UT to 1341 UT at the GOES 16. |
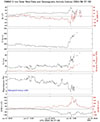 |
Figure S6. The solar wind parameters and geomagnetic activities for the June 28, 2024 storm event. From top to bottom, shown are the solar wind magnetic field strength with the southward component (red), solar wind speed, solar wind density with the dynamic pressure (red), model-esimated magnetopause distance, and the SYM-H and ASYM-H (red) indices. |
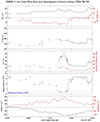 |
Figure S7. The solar wind parameters and geomagnetic activities for the August 4, 2024 storm event. From top to bottom, shown are the solar wind magnetic field strength with the southward component (red), solar wind speed, solar wind density with the dynamic pressure (red), model-esimated magnetopause distance, and the SYM-H and ASYM-H (red) indices. |
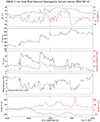 |
Figure S8. The solar wind parameters and geomagnetic activities for the September 12, 2024 storm event. From top to bottom, shown are the solar wind magnetic field strength with the southward component (red), solar wind speed, solar wind density with the dynamic pressure (red), model-esimated magnetopause distance, and the SYM-H and ASYM-H (red) indices. |
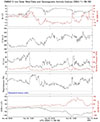 |
Figure S9. The solar wind parameters and geomagnetic activities for the November 9, 2024 storm event. From top to bottom, shown are the solar wind magnetic field strength with the southward component (red), solar wind speed, solar wind density with the dynamic pressure (red), model-esimated magnetopause distance, and the SYM-H and ASYM-H (red) indices. |
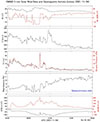 |
Figure S10. The solar wind parameters and geomagnetic activities for the November 4, 2021 storm event. From top to bottom, shown are the solar wind magnetic field strength with the southward component (red), solar wind speed, solar wind density with the dynamic pressure (red), model-esimated magnetopause distance, and the SYM-H and ASYM-H (red) indices. |
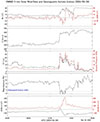 |
Figure S11. The solar wind parameters and geomagnetic activities for the March 24, 2024 storm event. From top to bottom, shown are the solar wind magnetic field strength with the southward component (red), solar wind speed, solar wind density with the dynamic pressure (red), model-esimated magnetopause distance, and the SYM-H and ASYM-H (red) indices. |
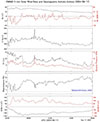 |
Figure S12. The solar wind parameters and geomagnetic activities for the September 17, 2024 storm event. From top to bottom, shown are the solar wind magnetic field strength with the southward component (red), solar wind speed, solar wind density with the dynamic pressure (red), model-esimated magnetopause distance, and the SYM-H and ASYM-H (red) indices. |
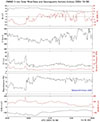 |
Figure S13. The solar wind parameters and geomagnetic activities for the October 8, 2024 storm event. From top to bottom, shown are the solar wind magnetic field strength with the southward component (red), solar wind speed, solar wind density with the dynamic pressure (red), model-esimated magnetopause distance, and the SYM-H and ASYM-H (red) indices. |
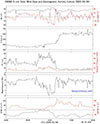 |
Figure S14. The solar wind parameters and geomagnetic activities for the March 26, 2025 storm event. From top to bottom, shown are the solar wind magnetic field strength with the southward component (red), solar wind speed, solar wind density with the dynamic pressure (red), model-esimated magnetopause distance, and the SYM-H and ASYM-H (red) indices. |
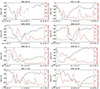 |
Figure S15. Pressure-corrected Dst index (Dst*, black) and the solar wind dynamic pressure for the all of the magnetic storm events (red) shown in this study. |
© T.M. Nakayama & R. Kataoka, Published by EDP Sciences 2026
Current usage metrics show cumulative count of Article Views (full-text article views including HTML views, PDF and ePub downloads, according to the available data) and Abstracts Views on Vision4Press platform.
Data correspond to usage on the plateform after 2015. The current usage metrics is available 48-96 hours after online publication and is updated daily on week days.
Initial download of the metrics may take a while.