Figure 17
Download original image
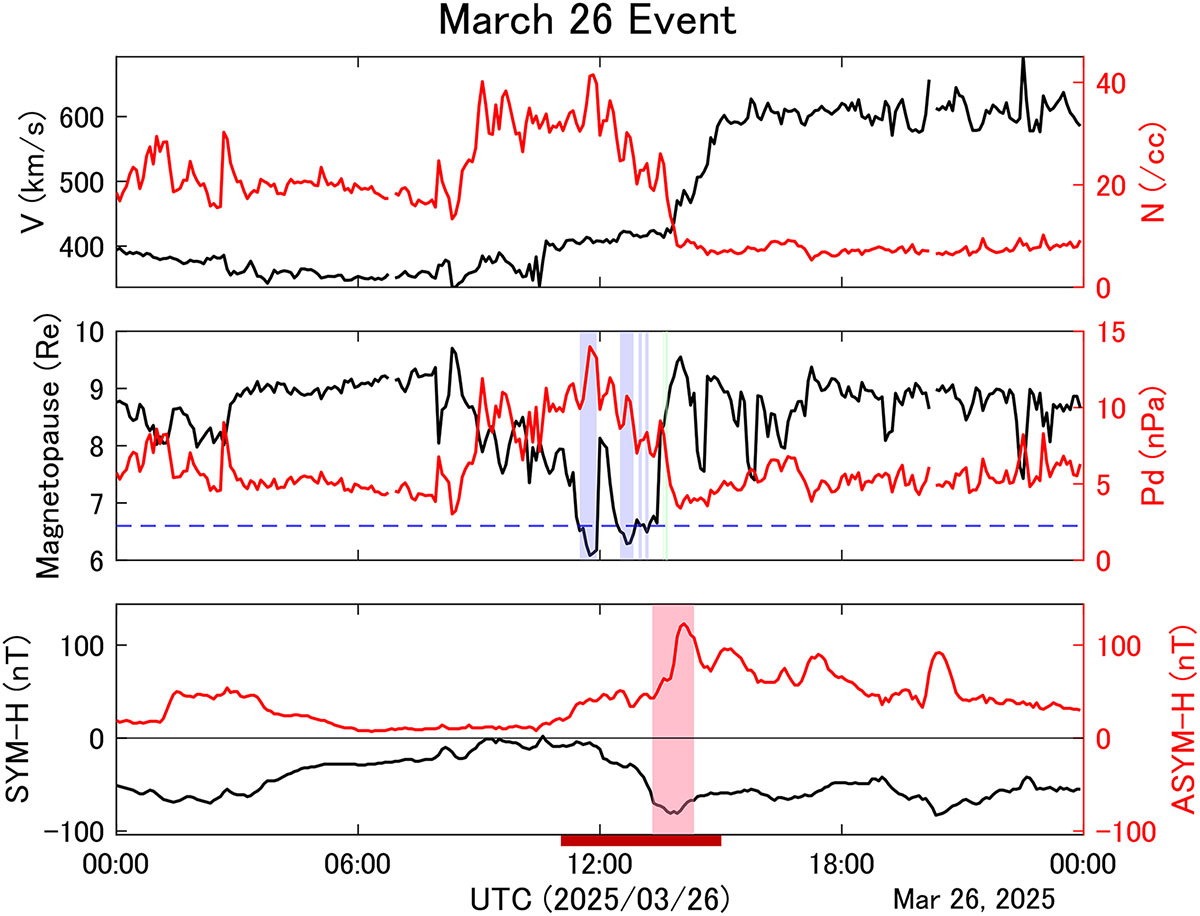
The variation in the solar wind velocity (V), density (N), dynamic pressure, the subsolar distance of modeled magnetopause, SYM-H and ASYM-H during magnetic storm on March 26, 2025. Red shaded regions represent the time periods when red auroras were observed by citizen scientists in Japan. Blue shaded regions show the time period of the subsolar distance of modeled magnetopause become smaller than 6.6 RE. Green shaded regions denote the time period of the GMC event observed by GOES 16 satellite. Red bar describes the time interval of calculated median value of V, N and Pd described in Table 1.
Current usage metrics show cumulative count of Article Views (full-text article views including HTML views, PDF and ePub downloads, according to the available data) and Abstracts Views on Vision4Press platform.
Data correspond to usage on the plateform after 2015. The current usage metrics is available 48-96 hours after online publication and is updated daily on week days.
Initial download of the metrics may take a while.