Figure 2
Download original image
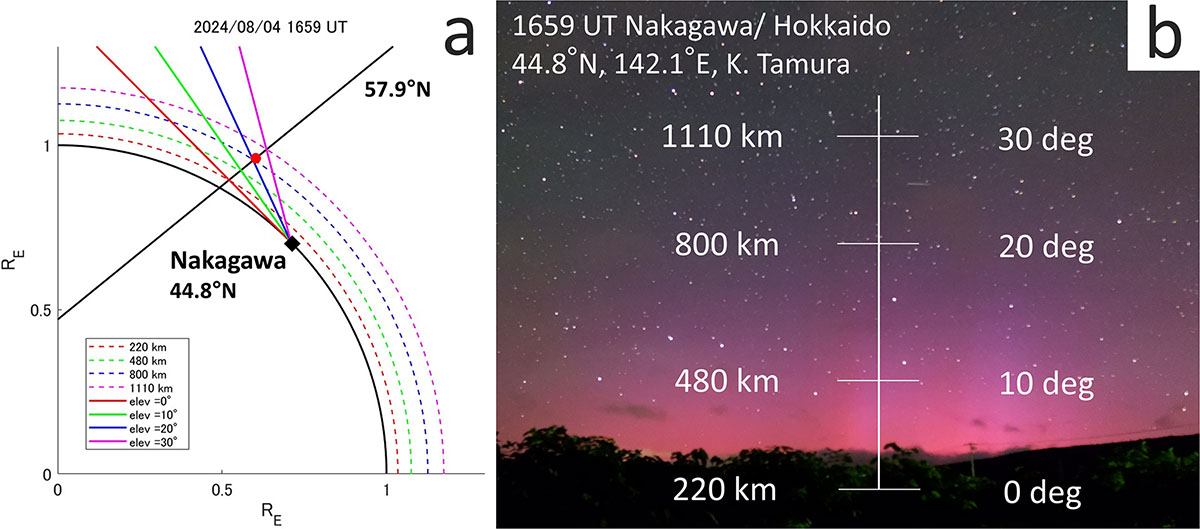
Estimation of auroral altitude using photograph taken by citizen scientist and satellite-derived magnetic field line. (a) The magnetic field line of the satellite location (red marker) is shown by black solid line. The lines-of-sight of 0-, 10-, 20-, 30-degree elevation angles are shown by red, green, blue, magenta solid lines. Each estimated altitude is indicated by the corresponding dotted curve, with altitudes of 220 km, 480 km, 800 km, and 1110 km. (b) The altitude distribution of auroral emission was visualized by superimposing an altitude grid on the photograph.
Current usage metrics show cumulative count of Article Views (full-text article views including HTML views, PDF and ePub downloads, according to the available data) and Abstracts Views on Vision4Press platform.
Data correspond to usage on the plateform after 2015. The current usage metrics is available 48-96 hours after online publication and is updated daily on week days.
Initial download of the metrics may take a while.