Figure S4.
Download original image
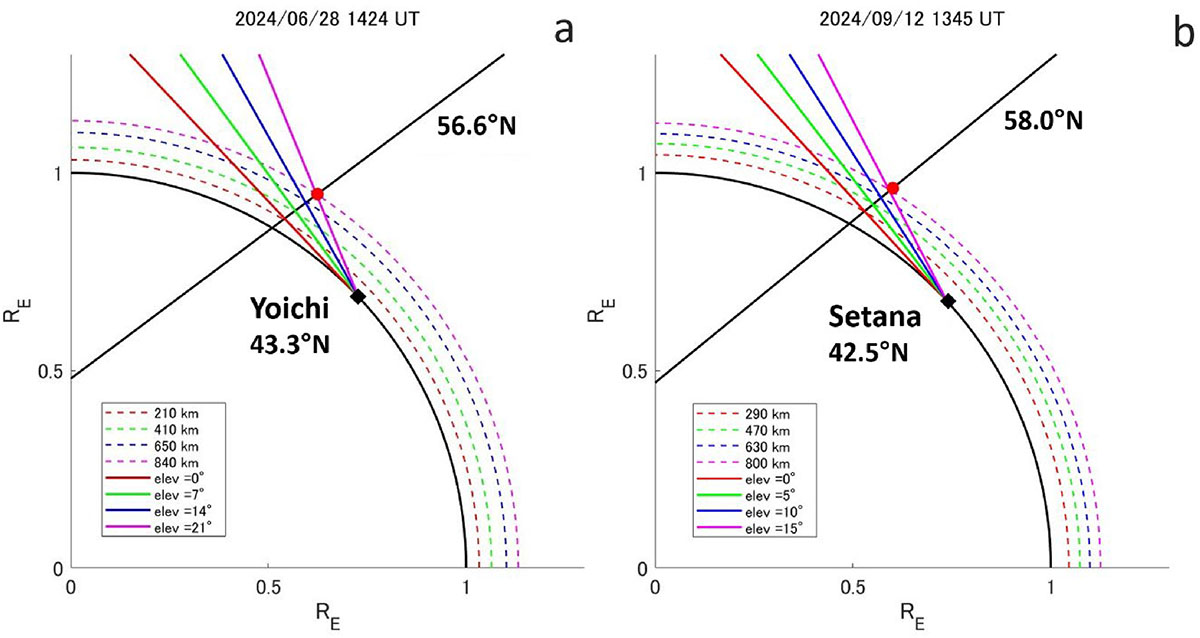
Workflow for the altitude estimation of the auroral upper edge for the June 28 and September 12 events. The magnetic field line at the location of the NOAA-18 satellite (red marker) is shown as a black solid line, while the black marker indicates the location of the observation site. The elevation angles of the auroral body were derived from photographs using stars as reference points and then projected onto the magnetic field line at the equatorward boundary of the auroral oval, as estimated from satellite data. (a) For the June 28, 2024, event observed from Yoichi (43.3°N), the lines of sight for elevation angles of 0°, 7°, 14°, and 21° are shown as red, green, blue, and magenta solid lines, respectively. Each estimated altitude is indicated by the corresponding dotted curve, with altitudes of 210 km, 410 km, 650 km, and 840 km. (b) For the September 12, 2024, event observed from Setana (42.5°N), the lines of sight for elevation angles of 0°, 5°, 10°, and 15° are shown as red, green, blue, and magenta solid lines, respectively. Each estimated altitude is indicated by the corresponding dotted curve, with altitudes of 290 km, 470 km, 630 km, and 800 km.
Current usage metrics show cumulative count of Article Views (full-text article views including HTML views, PDF and ePub downloads, according to the available data) and Abstracts Views on Vision4Press platform.
Data correspond to usage on the plateform after 2015. The current usage metrics is available 48-96 hours after online publication and is updated daily on week days.
Initial download of the metrics may take a while.