


| Issue |
J. Space Weather Space Clim.
Volume 16, 2026
|
|
|---|---|---|
| Article Number | 24 | |
| Number of page(s) | 16 | |
| DOI | https://doi.org/10.1051/swsc/2026021 | |
| Published online | 03 July 2026 | |
Technical Article
The Small Phased Array DEmonstrator (SPADE)
Description and first results
1
Solar Terrestrial Center of Excellence – Royal Observatory of Belgium, Avenue Circulaire 3, 1180 Brussels, Belgium
2
Center for mathematical Plasma Astrophysics, KU Leuven, Leuven, 3000 Belgium
* Corresponding author: This email address is being protected from spambots. You need JavaScript enabled to view it.
Received:
2
December
2025
Accepted:
18
May
2026
Abstract
We present the Small Phased Array DEmonstrator (SPADE), a compact phased array spectrograph designed for the monitoring of solar activity in the decameter range, where a majority of bursts of interest for solar physics and space weather occur. Unlike other existing phased arrays, SPADE operations like Sun tracking and spectra productions are made entirely digitally, and rely on the use of open source library software and commercial generic software defined radio receivers. In this paper, we describe the instrument and its associated software and present the first observations of the Sun and the Jovian magnetosphere conducted between September and December 2024. For the solar observations, in particular, we highlight the capacities of the instrument in terms of temporal and frequency resolution, making it capable of addressing science topics like turbulence in the coronal medium and propagation effects affecting radio waves, which are currently only accessible by larger but non-solar dedicated phased arrays.
Key words: Instrumentation: miscellaneous / Sun: corona / Sun: radio radiation / Planets and satellites: gaseous planets
© C. Marqué et al., Published by EDP Sciences 2026
 This is an Open Access article distributed under the terms of the Creative Commons Attribution License (https://creativecommons.org/licenses/by/4.0), which permits unrestricted use, distribution, and reproduction in any medium, provided the original work is properly cited.
1 Introduction
Since the second half of the twentieth century, radio observations of the Sun in the meter and decameter range (between ∼300 and 20 MHz) have provided a unique view on the eruptive processes taking place in the solar corona (Pick & Vilmer 2008). The acceleration of suprathermal electrons during eruptive events can trigger Langmuir wave instabilities and subsequently the production of electromagnetic radiation by coalescence of these waves or scattering off of ions (Dulk 1985). This results in a large variety of bursts with distinctive spectral signatures as observed on time/frequency diagrams also called dynamic spectra. These bursts provide information on the physical processes at work during the eruptive event itself: the opening of the magnetic field during the early phases of a flare or a filament eruption, the propagation of shock waves in the solar corona, or the restructuring of the magnetic field above the eruptive site in the aftermath of the event (Nindos et al. 2008). Radio observations in the meter and decameter range are therefore a key observational tool for the investigation of the solar corona, driving both fundamental research and operational space weather activities (Carley et al. 2020).
An obvious shortcoming of ground-based observations is their intermittent nature triggered by the day/night cycle at a given location, which mandates the setup of networks of instruments for continuous monitoring of solar activity. In the optical domain, the Global Oscillation Network Group (GONG), originally driven by the needs of helioseismology for continuous observations of the photospheric oscillations, provides a continuous survey, in white light and chromospheric lines, of the eruptive activity taking place in the lower solar atmosphere (Hill 2018). In radio, in the meter and decameter range, two networks of spectrographs currently exist: the US Air Force maintains a worldwide network of instruments in parallel to its fixed frequency Radio Solar Telescope Network. Data are nonetheless only available in real time for the US military and the Space Weather Prediction Center of NOAA, and are only publicly released a few months later. In addition, it currently relies on rather old sweep-frequency technologies and produces data with a low time resolution of 3 s (for a brief description, see the Learmonth Observatory website1). The e-Callisto network (Benz et al. 2009b) is a civilian alternative, available in real time, and with improved temporal resolution. However, it lacks instrumental coordination apart from the CALLISTO receiver itself, as each station has a different frequency coverage and resolution, a different sensitivity due to different antennas and front ends, and it is also based on an aging analog technology whose future is uncertain.
Recent instrumental developments in solar radio astronomy rely primarily on digital subsystems that provide some levels of flexibility in design phases and can handle even challenging observing environments (Benz et al. 2009a; Hamini et al. 2021), but they still require significant engineering developments in electronics and programming. In contrast, low-cost Software Defined Radio (SDR) receivers have grown in popularity in the amateur radio community and in the academic world for prototyping of radio systems. Two SDR receivers have been used since 2015 at the Humain radio astronomy station2, in Belgium, for the monitoring of solar activity in VHF (30–300 MHz) and L band (1–2 GHz). Based on this experience, we developed an SDR-based Small Phased Array DEmonstrator (SPADE) to investigate its performance for the monitoring of solar activity in the decameter range. The use of off-the-shelf receivers and of open source software libraries makes it easily replicable at other chosen locations around the world for the establishment of a network of identical instruments. We show, with the first observations presented here, that our solution is not only sufficient for a simple monitoring of solar activity, but that SPADE delivers data, with a spectral and time resolution in par with modern non-solar dedicated phased arrays.
2 The SPADE project
2.1 Solar observations at the Humain radio astronomy station
The Humain radio astronomy station was founded in 1953 by the Royal Observatory of Belgium to host the very first Belgian solar dedicated radio telescopes. It is located in a remote and rural area in the foothills of the Belgian Ardennes, near the town of Marche-en-Famenne. The largest instrument at the station was a 48 antenna radio heliograph operating at 408 MHz, which was in service from 1972 until 2001. Since 2008, new radio instruments have been set up at the station, making use of refurbished existing telescopes (6-m telescopes and 4-m telescopes from the heliograph, see Koeckelenbergh 1971 for a description). Today, one of the two 6-m dishes built in the 1960s is the main telescope in use for solar observations. It carries one high-frequency log-periodic feed antenna at the focal point and one low frequency log-periodic piggyback antenna on its side, which altogether serve three different radio spectrographs: an analog instrument part of the e-Callisto network (Benz et al. 2009b) (for the band 45–450 MHz), a digital receiver, ARCAS in parallel to CALLISTO (same frequency band), and a second digital receiver HSRS, covering the band 275–1495 MHz. The two digital instruments are SDR receivers programmed specifically to perform wide-band spectrography (a brief description of the HSRS receiver can be found in Marqué et al. 2018). Observations are fully automated and made available as quicklook files within 10–15 min on the website of the Observatory3; raw data are open access and are available by request.
2.2 Why a phased array?
Old radio telescopes, even fully-refurbished, are prone to mechanical failures and limitations inherent to their design and original purpose. For example, the current 6-m dish in operation can track the Sun from 7:30 until 16:00 UT and is limited in its hour angle motion amplitude by the locations of safety switches that prevent the parabola from hitting its pillar in winter (when the Sun is at low elevation). Moreover, going lower in frequency, in the decameter range, where radio bursts of interest for space weather forecast and fundamental research occur, while maintaining a sufficient sensitivity would require a parabola of unrealistic dimensions. Interferometry using fixed antennas (that is with no moving parts) is therefore a suitable option, and large phased arrays in the decameter range have been developed over the years using analog techniques, Clark Lake (Erickson & Fisher 1974), the Decameter Array in France (Boischot et al. 1980) or more recently a mix of analog and digital techniques, the Long Wavelength Array (Ellingson et al. 2013), LOFAR (van Haarlem et al. 2013), the Murchison Widefield Array (Tingay et al. 2013), NenuFAR, at the Nançay Observatory (Zarka et al. 2012) or UTR-2 (Konovalenko et al. 2016).
SPADE is a prototype of a small-size fully digital phased array based on SDR receivers. It was designed to properly evaluate the capacities of a compact-size instrument that could be replicated at several locations around the world for a near constant monitoring of solar activity in the decameter range.
2.3 Array and antennas
SPADE consists of eight identical antennas, which are dual-polarised broadband dipoles obtained from the NenuFAR project (Zarka et al. 2012). The antenna form factor and mechanical design are the same as the ones used in the Long Wavelength Array (Hicks et al. 2012), while the active electronics is tailor-made for NenuFAR and includes a very low noise amplifier, LONAMOS (LOw Noise Amplifier in MOS technology), developed by the French laboratory SUBATECH4. The overall usable frequency range covers the band 10–80 MHz.
The optimal array configuration was calculated at 50 MHz using the open source version5 of the Numerical Electromagnetic Code (Burke & Poggio 1981). Simulations were carried out using a ground dielectric constant of 15 (according to the International Telecommunication Union (ITU) Recommendation P527.3) and a conductivity of 0.009 S/m (ITU Recommendation P832.1). Aluminum was assumed for the antenna elements, and steel was used for the ground-plane mesh. The final configuration is shown on the left-hand side of Figure 1. To minimize side lobes, a uniform 20 by 20 m ground plane (instead of eight small individual ones) was introduced. The right hand side of Figure 1 shows cuts along the north-south and east-west directions of the calculated beam (when pointing at the zenith). The asymmetry of the array with respect to an east-west axis explains why the two patterns are slightly different.
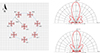 |
Figure 1. Left: Configuration of the eight antennas of SPADE; right: top, north-south cut of the resulting beam for a uniform 20 × 20 m ground plane, bottom, same but along the east-west direction. |
The reference antenna is placed at the center of the grid and of a circle of 5.5 m radius, where the seven other antennas are evenly distributed.
With the known positions of the antennas, it is possible to analytically calculate the beam pattern projected on the sky when pointing weights are applied (but not taking into account the individual antenna patterns). Figure 2 shows the resulting beam for an observation of the Sun, near local noon, on 02 October 2024. The Sun culminates on that day at ∼35 degrees elevation. The 3 dB beam width in azimuth is approximately 22, 27, and 35 degrees for respectively 65, 50, and 35 MHz, and always larger than 30 degrees in elevation for all frequencies. A summary of SPADE technical characteristics is given in Table 1.
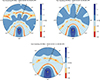 |
Figure 2. Analytical calculations of the beam pattern resulting from the chosen array configuration at different frequencies. The Sun is marked by a yellow dot not up to scale. |
SPADE main characteristics.
On the ground, the array and the 20 × 20 m metallic grid have been built on top of a flat platform that required embankment work to level off the terrain (see Fig. 3). RF cables are installed in underground pipes converging to an environment-controlled cabin (about 27 m away from the array center) hosting the solar receivers already operating at the station. For each antenna, two coaxial cables bring the signal to the cabin, but as of the time of writing, only one polarization is used. Each cable is connected to a bias tee providing power to the active electronics.
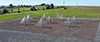 |
Figure 3. View of the SPADE array from the roof of the cabin containing the receivers, showing the eight antennas and the uniform ground plane on the platform. In the background, some of the 4 m dishes of the old radio heliograph can be seen. |
2.4 Receivers and programs
SPADE relies on commercial SDR receivers: two X300 Ettus Research receivers with two TwinRx daughterboards (DB) each, providing a total of eight inputs. This choice was driven by multiple factors. The first one is the existing in-house knowledge with dealing with receivers of the same brand (with ARCAS and HSRS). In addition, the default software library GNU Radio (Long et al. 2025) is well fitted for the beam forming and spectrometer tasks. Finally, the versatility of SDR receivers reduces the need for further radio frequency hardware developments for the different operations of the array.
The beam forming and steering of the array are entirely made by software and programmed using generic blocks available within GNU Radio. Figure 4 shows the latest version of the software controlling SPADE, as well as the physical links existing between the two receivers. On the hardware side, a common frequency (10 MHz) and pulse-per-second (1 pps) reference is provided by an external GPS clock. Each DB has its own set of two local oscillators (LO1 and LO2) used for the frequency conversion to the base band. The two local oscillators of the first DB are physically shared with the three other DBs, via a splitter and through amplification.
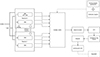 |
Figure 4. Schema of the SPADE receiver programs, showing both the physical connections between the receivers (the two square boxes on the left with the external reference signals and the sharing of the LOs between the daughterboards), and from there the dataflow within the program. The individual boxes from multiply_matrix to zeromq push sink are program blocks and their naming matches the ones available in GNU Radio. |
On the software side, steps are necessary to make sure the different DBs start streaming data synchronously. Expanding the work of Krueckemeier et al. (2019), a specific receiver block has been written, which starts the eight channels simultaneously via timed commands. The eight complex data streams are fed to a multiply-matrix block, where the input matrix contains the pointing weights calculated from an ephemeris (Skyfield Library; Rhodes 2019) and corrected for calibration weights compensating for different hardware-induced delays. A Fast Fourier Transform (FFT) is then applied to the resulting stream, converted to a quantity proportional to a power, and integrated to reduce the amount of data. Data are then pushed through an Ethernet port using the networking library Zeromq6. An external program “listens” to the same port, decodes the stream, and writes it into a Hierarchical Data Format (HDF) file. All routines are programmed in Python. The two receivers are connected via two 10 Gbit/s Ethernet connectors each to a unique desktop computer. Over a few months of exploitation and upgrades of the software, different bandwidths have been tested: 25, ∼33, and 50 MHz, which is now the baseline. With 50 MHz bandwidth, the FFT is performed over 16 384 channels, and 150 spectra are summed up before being written down. This results in a nominal frequency resolution of 3.052 kHz and a temporal resolution of 49.15 ms. A data file is 10 min long and is about 766 MB in size.
The pointing weights are calculated for a central frequency of 50 MHz and applied to the whole band due to the limited available computation power. Thus, a frequency-dependent pointing error (squint) is artificially induced that will be fully characterized in the future.
As already noted, phase errors are also introduced by the unavoidable delays that the signals suffer in cables and RF boards in the receivers. A calibration is made near 50 MHz by using an external beacon emitting a sine wave. The beacon is part of the Belgian RAdio Meteor Stations (BRAMS) experiment that monitors meteors over Belgium (Balis et al. 2023). The beacon, emitting at 49.97 MHz, is located at the Geophysical Center of the Royal Meteorological Institute in Dourbes, about 49 km to the south-west of the Humain radio astronomy station. For the calibration, observations of the beacon are performed with a narrow bandwidth of 200 kHz in a non-interferometric mode. Taking as a reference the antenna at the center of the array, phase lags are calculated to align each antenna record. The difference between the phase lags and the weights calculated to point the array towards the beacon gives the set of corrections to add to the pointing weights. For each antenna, the applied correction is a median value derived from several measurements made within a few minutes. Phase calibration is performed on a weekly basis. At the time of writing of this article, the data are not yet flux-calibrated.
2.5 Data availability
Quicklook images of SPADE solar observations have been made available since the end of September 2025 on the Humain website7 as plots covering 15-minute long time intervals. Raw data are open access but are only available by request due to their large size.
3 Observations
In this section and the associated appendices, we present and discuss solar and jovian observations collected since the summer of 2024 that illustrate the capabilities of the instrument. The solar observations that are presented first were performed with a total bandwidth of 33.333 MHz and an 8192 points FFT, resulting in a frequency resolution of 4.07 kHz and a time resolution of 49.15 ms. The presented dynamic spectra were processed as follows: no background was removed, but a local histogram equalization (per frequency) was applied to highlight the bursts.
3.1 Noise storms and type III storms
Noise storms are long-lasting periods of enhanced short-duration and narrow-band individual bursts (called type I) that are observed in association with large sunspot groups on the solar disc. They are produced by non-thermal electrons trapped in magnetic field lines of the active region and are sometimes observed in coincidence with type III storms, i.e., a large collection of individual type III bursts occurring at lower frequencies (Klein 1998). Both emissions are supposedly produced by the same population of suprathermal electrons, some of those being accelerated along closed field lines and the others along open ones. The boundary between closed and open field lines fluctuates and both emissions can be seen in the same frequency range as the source region properties evolve. We present here observations undertaken on 02 December 2024, when both a noise storm and a type III storm can be observed in the frequency range covered by SPADE. The dynamic spectrum shown in Figure A.1, top, covers the time interval 10:43–10:53 UT. It displays a typical pattern for noise storm observations, with a series of numerous, short-duration, and narrow-band bursts mostly seen at frequencies above ∼47 MHz. On the same plot, individual type III bursts from the associated type III storm are also clearly visible in the background at frequencies below ∼50 MHz (it even extends in the interplanetary medium as revealed by Wind/Waves observations, not shown here8). On the bottom part of Figure A.1, two short time intervals (around 11:39 and 11:48 UT) are shown when only the type III storm is observed. The well pronounced structures are fine reverse drift pair bursts (RDP) that are often observed superposed on the type III emissions (de La Noë & Moller Pedersen 1971). Numerous RDP bursts are observed on that day and the following one, with properties similar to the ones reported in the literature (Suzuki & Gary 1979): a simple shift in time (not in frequency), existing fine frequency structures, a majority of reverse drift bursts, and a majority of narrow-band bursts with few exceptions (like the one in Fig. A.1, bottom right, spanning approximately 17 MHz).
3.2 Type III and groups of type III bursts
Type III radio bursts are very common bursts observed in the meter and decameter range, and they occur either in isolation or in groups. They are produced by beams of suprathermal electrons accelerated along open or quasi-open magnetic field lines in flaring or micro-flaring events taking place in the corona. Type III bursts observed in the decameter range often display fine frequency structures that are linked to inhomogeneities of the coronal medium modulating the generation of Langmuir waves and subsequently of radio waves, as the electron beams propagate (Reid & Ratcliffe 2014; Jebaraj et al. 2023). Figure B.1 shows several type III bursts with and without fine structures observed on 09 September 2024. In addition to the bursts, one also notices several artifacts: an alias of the lower band is observed in the first few channels of the upper band (this is a documented behavior from the receiver electronic boards, and we see in practice that ∼10% of the band is affected); horizontal lines repeating every 10 MHz or so are interferences originating from the electronics within the receivers.
Figure B.2 shows a group of type III bursts displaying numerous fine structures on 02 October 2024. This radio event is associated with a M3.3 class flare (NOAA classification9) and extends to lower frequencies, into the interplanetary medium where it also displays a mix of irregular fine structures and more classical striae (see Jebaraj et al. 2023 for more details on structured interplanetary type III bursts).
3.3 Type II radio bursts
Meter and decameter type II bursts are signatures of shock waves propagating in the solar corona (see Nindos et al. 2008 for a review). They are observed as slow drifting structures often displaying fundamental and harmonic emission lanes, band split and occasionally numerous fine structures when observed with sufficient time and frequency resolution (Magdalenić et al. 2020). In this section, we present two examples of type II burst observations associated with M or X-class flares (NOAA Classification). Figure 5 shows an overview of the first event, which occurred on 18 November 2024. The soft X-ray light curve shows two peaks, one at 11:12 UT (magnitude M1.6) associated with a group of type III bursts and a second one a few minutes later at 11:27 UT (magnitude M1.5) associated with the type II burst. Both flares originate from the same active region (NOAA AR13897). The high time resolution observations by SPADE of this event are shown in Figure C.1, top panel. SPADE resolves the herringbone structure within the brightest drifting lane of the type II burst (middle panel of Fig. C.1), which is interpreted to be the harmonic lane of the event (with a band split seen as a weaker parallel structure). Between 11:30 and 11:35 UT, several type III bursts apparently starting off the shock signature (shock-accelerated type III bursts Dulk et al. 2000) are visible and extend to the interplanetary medium as observed by Wind/Waves (see Fig. 5). Within this group (lower right panel of Fig. C.1), between 11:34 and 11:35 UT, fine frequency periodic structures are observed. At first, when displayed with a low time and frequency resolutions, they resemble fine frequency structures seen in type IIIb bursts but differ in two aspects: they are grouped in compact clusters along the frequency axis and display an overall frequency drift comparable to the one of the type II burst. In the group of type III bursts that coincides with the first M-class flare (top panel and bottom left panel of Fig. C.1), periodic fine frequency structures are also observed (e.g., shortly after 11:14:30 UT) and are remarkable because of their duration (up to 7 s), the break in frequency drift, and the instantaneous width in frequency (∼40 kHz) and time (∼0.4 s at 38.92 MHz). Similar structures have been reported in the decameter range at different phases of type II bursts. Chernov (2011) discusses groups of fibers with instantaneous bandwidths between 250 and 500 kHz, where individual fibers have 50–90 kHz bandwidths, which is close to the present observations. Chernov attributes these emissions to interactions between plasma waves and whistlers produced by energetic electrons located between the shock and the CME leading edge, as it crosses regions of enhanced density (e.g., streamers). In the present case, coronagraphic observations with LASCO-C2 show indeed a streamer deflection, due to the passage of a CME-driven shock wave, making this interpretation plausible.
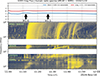 |
Figure 5. Overview of the eruptive event of 18 November 2024, showing the GOES light curves (top) together with a composite plot of radio observations from HSRS (Humain station, 1495–275 MHz), ORFEES (Nançay Observatory, 275–144 MHz), SPADE (Humain station, 66.7–33.3 MHz) and WIND/WAVES (14–1 MHz). The two black arrows under the GOES light curves mark the peak times of the flares mentioned in the text. |
Figure C.2 shows another type II burst that occurred on 08 December 2024. Associated with an X2.2 class flare (09:06 UT, peak time), the radio event is remarkable for its high number of fine frequency structures in shock-accelerated type III bursts. These fine structures differ morphologically from the ones discussed in the previous type II event, being closer, at all time and frequency scales, to the fine structures in type IIIb bursts. If the same emission mechanisms explaining type IIIb bursts apply here, this suggests a high degree of plasma turbulence (Reid & Kontar 2021) in the wake of the energy release of the flare. Yet, within the same time frame, periodic and organized fine structures are also seen in bursts, drifting in frequency at rates comparable to those of the type II (bottom panels of Fig. C.2).
Figure 6 highlights two of these quasi-periodic bursts with colored lines marking the cuts in time and frequencies shown on the right panels. A Lomb–Scargle periodogram applied to the blue curve (less noisy) reveals a periodicity of ∼1.62 s in time and ∼0.164 MHz in frequency. These two bursts are reminiscent of fringed S bursts mentioned by McConnell & Ellis (1981) in the decameter range or of pseudo-periodic bursts in L band (Oberoi et al. 2009), but they differ by their duration, about a minute in total (less than a second for S bursts), and the number of “fringes”, about 40 (10–15 for fringed S bursts). McConnell & Ellis (1981) suggested the possibility of linearly polarized emissions experiencing Faraday rotation in the solar corona and the Earth’s ionosphere as observed by a linearly polarized antenna. In the present case, observations with the New Routine of Nançay Decameter Array (Lamy et al. 2022) (not shown here) indicate that these bursts are essentially right-hand circularly polarised.
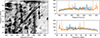 |
Figure 6. Excerpt of the quasi-periodic bursts observed during the type II event of 08 December 2024, with time and frequency cuts displayed on the right-hand side. |
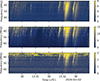 |
Figure 7. Observations between 13:30 and 13:33 UT of the group of type III bursts on 02 October 2024, made by SPADE (top), NDA (middle), and the GERMANY-DLR CALLISTO station (bottom). The intensity scale represents dB over background. |
3.4 Jovian magnetosphere
The Jovian magnetosphere is a powerful source of radio emission in the decameter range. Energetic electrons, via electron cyclotron maser instabilities, produce radio emissions related to auroras on Jupiter or to interactions between Io and Jupiter’s magnetic field (Marques et al. 2017). The occurrence of the latter depends on the structure of the magnetic field of Jupiter and its rotation with the planet, the relative position of Io, and its visibility by the observer. This makes Io-related radio emission to some extent predictable (Aicardi et al. 2022). We performed test observations of these Io-induced emissions several days in a row in November and December 2024 during night time, with a special observing setup of the receiver (bandwidth of 25 MHz, a central frequency of 20 MHz, and time and frequency resolutions respectively of 40.96 ms and 3.052 kHz). This unusual setup allows observations of jovian emissions down to ∼10–15 MHz, a frequency range accessible only at night when the D and E layers of the ionosphere disappear. Figure D.1 shows two periods of activity on 01 December 2024. A local histogram equalization (per frequency) has been applied to enhance the visibility of the jovian emissions. Broadband emissions modulated by interplanetary scintillation, as well as arc-shaped bursts are visible (Marques et al. 2017). Both display Faraday fringes resulting from the propagation of the polarised emission from Jupiter through the Earth’s ionosphere as received by the linearly-polarised antennas of SPADE (Litvinenko et al. 2009).
4 Discussion and conclusion
The observations presented in this article show that a small phased array (less than 10% the number of antennas of a single Low Band (LBA) station from LOFAR) can provide high-quality observations of a whole range of decameter radio emissions from the Sun and even Jupiter’s magnetosphere. While this frequency range can be covered by a single antenna similar to the ones used in SPADE (some stations from the e-Callisto network use LWA-derived antenna with a custom-made active part), the combination of a larger collective area, a high frequency and time resolution give SPADE access to a large variety of fine and fainter structures, in par with what is observed with larger instruments. As an illustration, Figure 7 compares observations of the group of type III bursts of 02 October 2024 (see Fig. B.2), made by three different instruments: SPADE, on the top, the New Routine (Lamy et al. 2022) of the Nançay Decameter Array (NDA), in the middle, and the “GERMANY-DLR” CALLISTO station operating a LWA-type antenna, at the bottom. The three data sets are plotted on a logarithmic intensity scale (dB over background) over the same time and frequency intervals as SPADE. The NDA panel shows the sum of both right and left hand polarisations, while for CALLISTO, only one circular polarisation is shown. For this event, NDA has the highest Signal to Noise Ratio (SNR), followed by SPADE (about 5 times smaller) and then CALLISTO. Yet, the level of fine structures seen in SPADE and NDA looks comparable, in contrast with the observations of the CALLISTO station, where only the brightest type III bursts of the group are clearly detected, with very few fine structures and with a much lower SNR.
Generally speaking, the current limitations of SPADE can easily be solved: polarisation measurements can be achieved with a new set of receivers, while the current time resolution depends on how fast spectra can be written on disc, on the PC that currently controls the receivers. For solar observations, the pointing of the instrument is made specifically for 50 MHz, and as said earlier, this introduces squint at other frequencies. This problem could be solved in different ways. A software-based filter bank could be introduced into the data flow to apply different pointing weights in different sub-bands. This is out of reach with the current computer, and we will investigate if part of the tasks can be delegated to the FPGAs within the receivers. Indeed, the software library controlling the receivers10 has specific blocks, also available via GNU Radio, to “easily” implement into the receivers’ FPGAs, tasks that are currently performed by the CPU of the control PC. Another solution to the squint issue is to perform a true time delay pointing (that is, working in the time domain instead of the frequency domain). This is currently not achievable with the computer used by SPADE, but this will be investigated for future developments.
These preliminary results show that a small phased array is a powerful tool for the monitoring of solar activity, either for space weather or for more fundamental research. It does not compete in terms of performances with much larger instruments like LOFAR, MWA, or NenuFAR, and it lacks in particular imaging capabilities due to its small size, but it is fully solar dedicated and could be easily replicated at other locations on Earth to provide 24/7 observations of the solar corona in the decameter range. As such, it differs from the Incremental Development of LOFAR for Space Weather (IDOLS)11, where new hardware adds to a single LOFAR station the capability to both monitoring Space Weather (Sun or ionosphere) and still contribute to the whole LOFAR array observations. In that context, SPADE compensates for a lower sensitivity and versatility with a much lower price, a lower technical complexity, and therefore a larger potential for a world-wide network of stations. Based on astronomical criteria, a minimum of 5 stations evenly spread in longitude would already provide nearly 24-hour coverage. A couple of extra stations would allow for 24-hour coverage all year long. The construction and setup of a whole observing network was beyond the reach of the SPADE project. It is our hope that the observations presented in this article will trigger interest in such a network. More affordable SDR receivers reach the market and make this possibility even more real. As of the time of writing of this article, the SPADE prototype daily operations are funded by the Royal Observatory of Belgium. Thanks to this support, SPADE provides near-realtime information on solar activity to ROB’s space weather service, while data are available to a larger scientific community.
Acknowledgments
We thank the RSDB service at LESIA/USN (Observatoire de Paris) for making the ORFEES data available, and acknowledge the Nançay Radio Observatory (UAR 704-CNRS, supported by Université d’Orléans, OSUC, and Région Centre in France) for providing access to NDA observations. We thank the PIs of Wind/Waves: Dr. Karine Issautier (LESIA, Observatoire de Paris-PSL, CNRS) and Keith Goetz (University of Minnesota) for making their data openly accessible, in particular via the Coordinated Data Analysis Web. We thank the Institute for Data Science FHNW Brugg/Windisch, Switzerland, for making openly accessible the data from the e-callisto network. C.M. and A.M.P acknowledge useful discussions and exchange with C. Craeye and M. Drouguet from Université Catholique de Louvain during the design phase of the project. C.M. wishes to thank A. Kerdraon and A. Lecacheux from the Paris Observatory for early discussions prior to the definition of the SPADE project and L. Denis (Nançay Observatory) and P. Zarka (Paris Observatory, PI of NenuFAR) for their help in the selection process and purchase of the antennas. Finally, C. M. and A.M.P. wish to thank members of ROB’s technical service: M. de Knijf, R. de Dobbeleer, J. Duquesne, A. Ergen, and V. Honet, as well as P. Motte, for their important contribution in the construction and transportation of the different elements of SPADE. The editor thanks Pietro Zucca and Mario Bisi for their assistance in evaluating this paper.
Funding
The SPADE project was funded by the BRAIN-be pioneer program from the Belgian Science Policy Office under grant BR/314/PI/SPADE and co-funded by the Solar Terrestrial Center of Excellence (STCE). J. M. acknowledges financial support by the University start-up grant 3E220031 and the FEDtWIN project PERIHELION.
Conflicts of interest
The authors declare no Conflict of Interest.
Data availability statement
SPADE data presented in this article can be obtained by a simple demand to the corresponding author.
References
- Aicardi S, Cecconi B, Lamy L. 2022. Jupiter Probability Tool (Version 1.0). PADC/MASER. https://doi.org/10.25935/TV9M-HX48. [Google Scholar]
- Balis J, Lamy H, Anciaux M, Jehin E. 2023. Reconstructing meteoroid trajectories using forward scatter radio observations from the BRAMS network. Radio Sci 58(6): e2023RS007697. https://doi.org/10.1029/2023RS007697. [Google Scholar]
- Benz AO, Monstein C, Beverland M, Meyer H, Stuber B. 2009a. High spectral resolution observation of decimetric radio spikes emitted by solar flares – First results of the Phoenix-3 spectrometer. Sol Phys 260(2): 375–388. https://doi.org/10.1007/s11207-009-9455-1. [Google Scholar]
- Benz AO, Monstein C, Meyer H, Manoharan PK, Ramesh R, et al. 2009b. A world-wide net of solar radio spectrometers: e-CALLISTO. Earth Moon Planets 104(1–4): 277–285. https://doi.org/10.1007/s11038-008-9267-6. [NASA ADS] [CrossRef] [Google Scholar]
- Boischot A, Rosolen C, Aubier MG, Daigne G, Genova F, et al. 1980. A new high-gain, broadband, steerable array to study Jovian decametric emission. Icarus 43(3): 399–407. https://doi.org/10.1016/0019-1035(80)90185-2. [NASA ADS] [CrossRef] [Google Scholar]
- Burke GJ, Poggio AJ. 1981. Numerical electromagnetics code (NEC) – Method of moments, Technical Report UCID-18834, Lawrence Livermore National Laboratory. [Google Scholar]
- Carley EP, Baldovin C, Benthem P, Bisi MM, Fallows RA, et al. 2020. Radio observatories and instrumentation used in space weather science and operations. J Space Weather Space Clim 10: 7. https://doi.org/10.1051/swsc/2020007. [Google Scholar]
- Chernov GP. 2011. Fine Structure of Solar Radio Bursts, Vol. 375, Springer-Verlag, Berlin, Heidelberg. https://doi.org/10.1007/978-3-642-20015-1. [Google Scholar]
- de La Noë J, Moller Pedersen B. 1971. Relationship between drift pair bursts and decametre type III solar radio emission. Astron Astrophys 12: 371. [Google Scholar]
- Dulk GA. 1985. Radio emission from the Sun and stars. ARA&A 23: 169–224. https://doi.org/10.1146/annurev.aa.23.090185.001125. [NASA ADS] [CrossRef] [Google Scholar]
- Dulk GA, Leblanc Y, Bastian TS, Bougeret J-L. 2000. Acceleration of electrons at type II shock fronts and production of shock-accelerated type III bursts. J Geophys Res 105(A12): 27,343–27,352. https://doi.org/10.1029/2000JA000076. [Google Scholar]
- Ellingson SW, Taylor GB, Craig J, Hartman J, Dowell J, et al. 2013. The LWA1 radio telescope. IEEE Trans Antennas Propag 61(5): 2540–2549. https://doi.org/10.1109/TAP.2013.2242826. [Google Scholar]
- Erickson WC, Fisher JR. 1974. A new wideband, fully steerable, decametric array at Clark Lake. Radio Sci 9: 387–401. https://doi.org/10.1029/RS009i003p00387. [Google Scholar]
- Hamini A, Auxepaules G, Birée L, Kenfack G, Kerdraon A, et al. 2021. ORFEES – A radio spectrograph for the study of solar radio bursts and space weather applications. J Space Weather Space Clim 11: 57. https://doi.org/10.1051/swsc/2021039. [Google Scholar]
- Hicks BC, Paravastu-Dalal N, Stewart KP, Erickson WC, Ray PS, et al. 2012. A wide-band, active antenna system for long wavelength radio astronomy. PASP 124(920): 1090. https://doi.org/10.1086/668121. [CrossRef] [Google Scholar]
- Hill F. 2018. The global oscillation network group facility–an example of research to operations in space weather. Space Weather 16(10): 1488–1497. https://doi.org/10.1029/2018SW002001. [NASA ADS] [CrossRef] [Google Scholar]
- Jebaraj IC, Magdalenić J, Krasnoselskikh V, Krupar V, Poedts S. 2023. Structured type III radio bursts observed in interplanetary space. Astron Astrophys 670: A20. https://doi.org/10.1051/0004-6361/202243494. [Google Scholar]
- Klein K-L. 1998. Suprathermal electrons in non-flaring active regions (invited review). In: Three-Dimensional Structure of Solar Active Regions, Alissandrakis CE, Schmieder B (Eds.), Vol. 155 of Astronomical Society of the Pacific Conference Series, 182 pp. [Google Scholar]
- Koeckelenbergh A. 1971. Solar activity observations at Uccle and Humain stations. Sol Phys 16(2): 497–500. https://doi.org/10.1007/BF00162495. [Google Scholar]
- Konovalenko A, Sodin L, Zakharenko V, Zarka P, Ulyanov O, et al. 2016. The modern radio astronomy network in Ukraine: UTR-2, URAN and GURT. Exp Astron 42(1): 11–48. https://doi.org/10.1007/s10686-016-9498-x. [Google Scholar]
- Krueckemeier M, Schwartau F, Monka-Ewe C, Technische JS. 2019. Synchronization of multiple USRP SDRs for coherent receiver applications. In: 2019 Sixth International Conference on Software Defined Systems (SDS), pp. 11–16. https://doi.org/10.1109/SDS.2019.8768634. [Google Scholar]
- Lamy L, Kenfack G, Duchêne A, Cecconi B, Loh A, et al. 2022. ORN NDA NewRoutine Sun EDR FITS dataset (Version 1.1). https://doi.org/10.25935/10.25935/x1yw-1w68. [Google Scholar]
- Litvinenko GV, Lecacheux A, Rucker HO, Konovalenko AA, Ryabov BP, et al. 2009. Modulation structures in the dynamic spectra of Jovian radio emission obtained with high time-frequency resolution. Astron Astrophys 493(2): 651–660. https://doi.org/10.1051/0004-6361:200809676. [Google Scholar]
- Long J, Morman J, Abele J, Aigner P, Alok A, et al. 2025. GNU Radio. URL https://doi.org/10.5281/zenodo.14897743. [Google Scholar]
- Magdalenić J, Marqué C, Fallows RA, Mann G, Vocks C, et al. 2020. Fine structure of a solar type II radio burst observed by LOFAR. Astrophys J Lett 897(1): L15. https://doi.org/10.3847/2041-8213/ab9abc. [Google Scholar]
- Marqué C, Klein K-L, Monstein C, Opgenoorth H, Pulkkinen A, et al. 2018. Solar radio emission as a disturbance of aeronautical radionavigation. J Space Weather Space Clim 8: A42. https://doi.org/10.1051/swsc/2018029. [CrossRef] [EDP Sciences] [Google Scholar]
- Marques MS, Zarka P, Echer E, Ryabov VB, Alves MV, et al. 2017. Statistical analysis of 26 yr of observations of decametric radio emissions from Jupiter. Astron Astrophys 604: A17. https://doi.org/10.1051/0004-6361/201630025. [Google Scholar]
- McConnell D, Ellis GRA. 1981. Fine structure in fast drift storm bursts. Sol Phys 69(1): 161–168. https://doi.org/10.1007/BF00151263. [Google Scholar]
- Nindos A, Aurass H, Klein KL, Trottet G. 2008. Radio emission of flares and coronal mass ejections. Invited review. Sol Phys 253(1–2): 3. https://doi.org/10.1007/s11207-008-9258-9. [CrossRef] [Google Scholar]
- Oberoi D, Evarts ER, Rogers AEE. 2009. High temporal and spectral resolution interferometric observations of unusual solar radio bursts. Sol Phys 260(2): 389–400. https://doi.org/10.1007/s11207-009-9459-x. [Google Scholar]
- Pick M, Vilmer N. 2008. Sixty-five years of solar radioastronomy: Flares, coronal mass ejections and Sun Earth connection. Astron Astrophys Rev 16: 1–153. https://doi.org/10.1007/s00159-008-0013-x. [CrossRef] [Google Scholar]
- Reid HAS, Kontar EP. 2021. Fine structure of type III solar radio bursts from Langmuir wave motion in turbulent plasma. Nat Astron 5: 796–804. https://doi.org/10.1038/s41550-021-01370-8. [Google Scholar]
- Reid HAS, Ratcliffe H. 2014. A review of solar type III radio bursts. Res Astron Astrophys 14(7): 773–804. https://doi.org/10.1088/1674-4527/14/7/003. [Google Scholar]
- Rhodes B. 2019. Skyfield: High precision research-grade positions for planets and Earth satellites generator. Astrophysics Source Code Library, record ascl:1907.024. [Google Scholar]
- Suzuki S, Gary DE. 1979. Position and polarization of solar drift pair bursts. Publ Astron Soc Aust 3(5–6): 379–383. https://doi.org/10.1017/S1323358000026151. [Google Scholar]
- Tingay SJ, Goeke R, Bowman JD, Emrich D, Ord SM, et al. 2013. The Murchison widefield array: The square kilometre array precursor at low radio frequencies. Publ Astron Soc Aust 30: e007. https://doi.org/10.1017/pasa.2012.007. [Google Scholar]
- van Haarlem MP, Wise MW, Gunst AW, Heald G, McKean JP, et al. 2013. LOFAR: The low-frequency array. Astron Astrophys 556: A2. https://doi.org/10.1051/0004-6361/201220873. [Google Scholar]
- Zarka P, Girard JN, Tagger M, Denis L. 2012. LSS/NenuFAR: The LOFAR super station project in Nançay. In: SF2A-2012: Proceedings of the Annual Meeting of the French Society of Astronomy and Astrophysics, Boissier S, de Laverny P, Nardetto N, Samadi R, Valls-Gabaud D, et al. (Eds.), pp. 687–694. [Google Scholar]
Appendix A
Noise storms
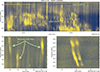 |
Figure A.1. Noise storm and type III storm (top) and Reverse Drift Pair bursts (bottom left and right) observed on 02 December 2024. |
Appendix B
Type III and groups of type III bursts
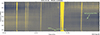 |
Figure B.1. Type III and type IIIb bursts observed by SPADE on 09 September 2024. |
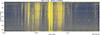 |
Figure B.2. Group of type III bursts observed on 02 October 2024 displaying numerous frequency fine structures. |
Appendix C
Type II bursts
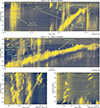 |
Figure C.1. Type II burst event of 18 November 2024. Top panel: overview of the event encompassing the two successive flares related to this radio event. Middle panel: excerpt on the type II burst itself, highlighting the shock-accelerated type III bursts and the herringbone structure of the brightest lane of the type II. Bottom panels: left, excerpt of the first group of type III bursts (first flare), right panel: zoom on the shock-accelerated type III bursts. |
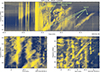 |
Figure C.2. Type II burst event of 08 December 2024. Top panel: overview of the event. Bottom panels: excerpts of the shock accelerated type III bursts with numerous fine underlying frequency fragmentation. |
Appendix D
Jovian magnetosphere
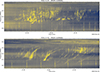 |
Figure D.1. Jovian decameter emissions observed at night times on 01 December 2024. The periodic vertical bars above 25 MHz are interferences. |
See https://www.swpc.noaa.gov/noaa-scales-explanation
Cite this article as: Marqué C, Martínez Picar A, Magdalenić J & Tassan-Din E. 2026. The Small Phased Array DEmonstrator (SPADE). J. Space Weather Space Clim. 16, 24. https://doi.org/10.1051/swsc/2026021.
All Tables
All Figures
|
Figure 1. Left: Configuration of the eight antennas of SPADE; right: top, north-south cut of the resulting beam for a uniform 20 × 20 m ground plane, bottom, same but along the east-west direction. |
| In the text | |
|
Figure 2. Analytical calculations of the beam pattern resulting from the chosen array configuration at different frequencies. The Sun is marked by a yellow dot not up to scale. |
| In the text | |
|
Figure 3. View of the SPADE array from the roof of the cabin containing the receivers, showing the eight antennas and the uniform ground plane on the platform. In the background, some of the 4 m dishes of the old radio heliograph can be seen. |
| In the text | |
|
Figure 4. Schema of the SPADE receiver programs, showing both the physical connections between the receivers (the two square boxes on the left with the external reference signals and the sharing of the LOs between the daughterboards), and from there the dataflow within the program. The individual boxes from multiply_matrix to zeromq push sink are program blocks and their naming matches the ones available in GNU Radio. |
| In the text | |
|
Figure 5. Overview of the eruptive event of 18 November 2024, showing the GOES light curves (top) together with a composite plot of radio observations from HSRS (Humain station, 1495–275 MHz), ORFEES (Nançay Observatory, 275–144 MHz), SPADE (Humain station, 66.7–33.3 MHz) and WIND/WAVES (14–1 MHz). The two black arrows under the GOES light curves mark the peak times of the flares mentioned in the text. |
| In the text | |
|
Figure 6. Excerpt of the quasi-periodic bursts observed during the type II event of 08 December 2024, with time and frequency cuts displayed on the right-hand side. |
| In the text | |
|
Figure 7. Observations between 13:30 and 13:33 UT of the group of type III bursts on 02 October 2024, made by SPADE (top), NDA (middle), and the GERMANY-DLR CALLISTO station (bottom). The intensity scale represents dB over background. |
| In the text | |
|
Figure A.1. Noise storm and type III storm (top) and Reverse Drift Pair bursts (bottom left and right) observed on 02 December 2024. |
| In the text | |
|
Figure B.1. Type III and type IIIb bursts observed by SPADE on 09 September 2024. |
| In the text | |
|
Figure B.2. Group of type III bursts observed on 02 October 2024 displaying numerous frequency fine structures. |
| In the text | |
|
Figure C.1. Type II burst event of 18 November 2024. Top panel: overview of the event encompassing the two successive flares related to this radio event. Middle panel: excerpt on the type II burst itself, highlighting the shock-accelerated type III bursts and the herringbone structure of the brightest lane of the type II. Bottom panels: left, excerpt of the first group of type III bursts (first flare), right panel: zoom on the shock-accelerated type III bursts. |
| In the text | |
|
Figure C.2. Type II burst event of 08 December 2024. Top panel: overview of the event. Bottom panels: excerpts of the shock accelerated type III bursts with numerous fine underlying frequency fragmentation. |
| In the text | |
|
Figure D.1. Jovian decameter emissions observed at night times on 01 December 2024. The periodic vertical bars above 25 MHz are interferences. |
| In the text | |
Current usage metrics show cumulative count of Article Views (full-text article views including HTML views, PDF and ePub downloads, according to the available data) and Abstracts Views on Vision4Press platform.
Data correspond to usage on the plateform after 2015. The current usage metrics is available 48-96 hours after online publication and is updated daily on week days.
Initial download of the metrics may take a while.