| Issue |
J. Space Weather Space Clim.
Volume 16, 2026
|
|
|---|---|---|
| Article Number | 17 | |
| Number of page(s) | 20 | |
| DOI | https://doi.org/10.1051/swsc/2026008 | |
| Published online | 19 May 2026 | |
Supplementary material
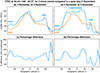 |
Fig. S1.1: Latitudinal profiles of VTEC in the American sector (GLon = -100°) for the 4 and 5 November events compared to the quiet-time baseline on 3 November. All the curves are for 20:00 UT. During the 4 November event, VTEC was enhanced mainly at high latitudes, by up to 50-100%, and also formed an SED plume where VTEC was enhanced by ~70%. During the 5 November storm, a notable superfountain effect could be seen, with the EIA crests extending up to ~30-40° QDLat (see also Figure 5 in the main text), and the corresponding VTEC increases by up to 100%. |
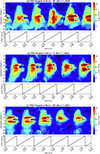 |
Fig. S1.2: UQRG VTEC keograms for the American (a), European (b) and Australian (c) sectors during the period of the study. In the American sector, a notable superfountain effect was formed around 18-20 UT on 5 November (during the storm’s main phase consistent with PPEF action). In the Australian sector, one could observe merging of the EIA crests in the recovery phase of the storm, consistent with thermospheric changes (strongly depleted O/N2 ratios in the region). |
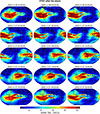 |
Fig. S1.3: VTEC maps on 6-7 November 2023 (after the storm). |
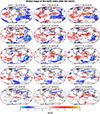 |
Fig. S1.4: Global maps of the IsUG index on 6-7 November 2023 (after the storm). The negative phase could be seen up to 10 UT on 7 November. |
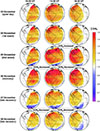 |
Fig. S1.5: GOLD O/N2 scans for the period of the study. During the main storm on 5 November 2023, O/N2 ratios were enhanced at mid-latitudes in the Northern hemisphere but showed a strong decrease at high-latitude regions in the Southern hemisphere. |
|
Fig. S1.6: Equivalent convection patterns derived from Supermag. During the first moderate event on 4 November, one could see enhanced convection compared to the quiet conditions on 3 November. During the strong 5 November event, the convection patterns were much stronger and expanded down to 40° of latitude. |
Supplementary animation S2:
Download Video: Formats: mp4 (326.8 KB) | webm (262.6 KB) | ogg (5.0 MB) | Original mp4 (326.8 KB)
Supplementary animation S3:
Download Video: Formats: mp4 (540.4 KB) | webm (413.1 KB) | ogg (8.5 MB) | Original mp4 (540.4 KB)
© A. Smirnov et al., Published by EDP Sciences 2026
Current usage metrics show cumulative count of Article Views (full-text article views including HTML views, PDF and ePub downloads, according to the available data) and Abstracts Views on Vision4Press platform.
Data correspond to usage on the plateform after 2015. The current usage metrics is available 48-96 hours after online publication and is updated daily on week days.
Initial download of the metrics may take a while.