Fig. S1.1:
Download original image
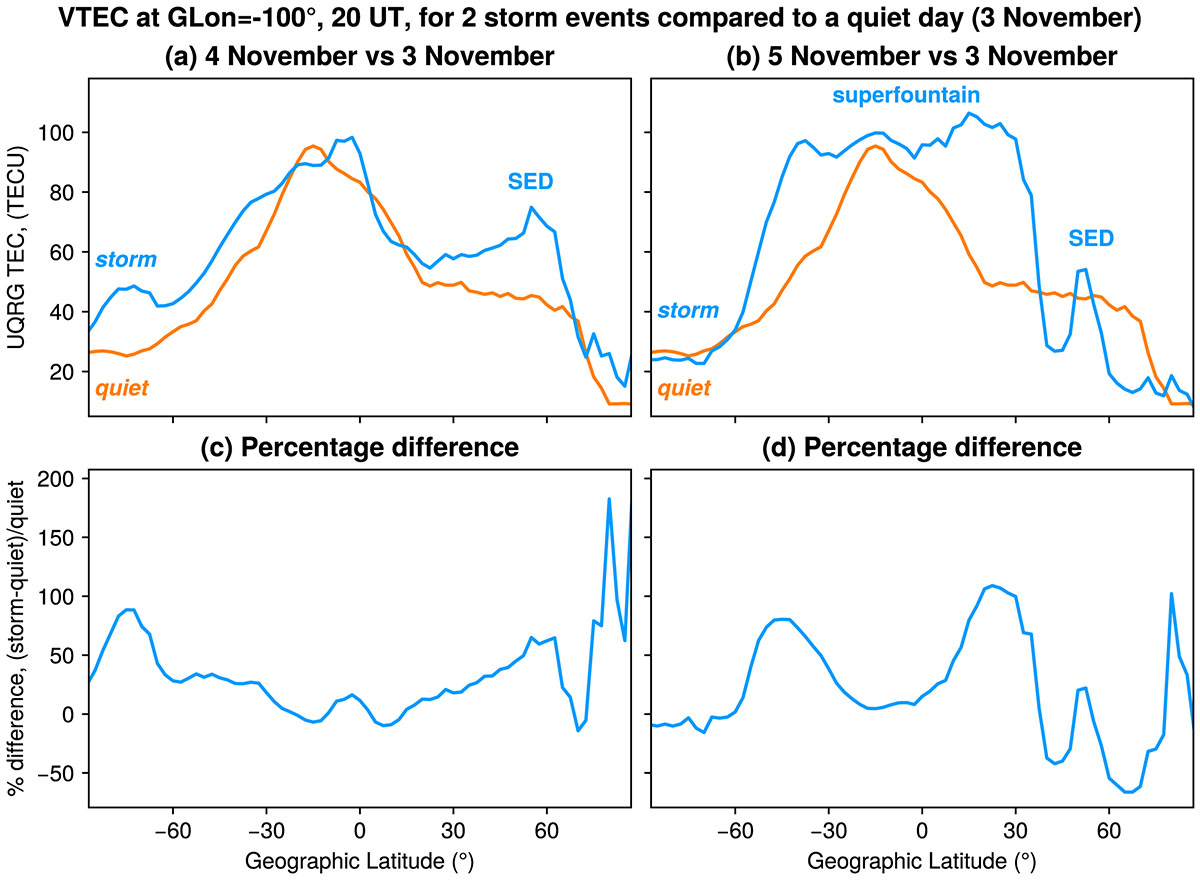
Latitudinal profiles of VTEC in the American sector (GLon = -100°) for the 4 and 5 November events compared to the quiet-time baseline on 3 November. All the curves are for 20:00 UT. During the 4 November event, VTEC was enhanced mainly at high latitudes, by up to 50-100%, and also formed an SED plume where VTEC was enhanced by ~70%. During the 5 November storm, a notable superfountain effect could be seen, with the EIA crests extending up to ~30-40° QDLat (see also Figure 5 in the main text), and the corresponding VTEC increases by up to 100%.
Current usage metrics show cumulative count of Article Views (full-text article views including HTML views, PDF and ePub downloads, according to the available data) and Abstracts Views on Vision4Press platform.
Data correspond to usage on the plateform after 2015. The current usage metrics is available 48-96 hours after online publication and is updated daily on week days.
Initial download of the metrics may take a while.