Fig. S1.2:
Download original image
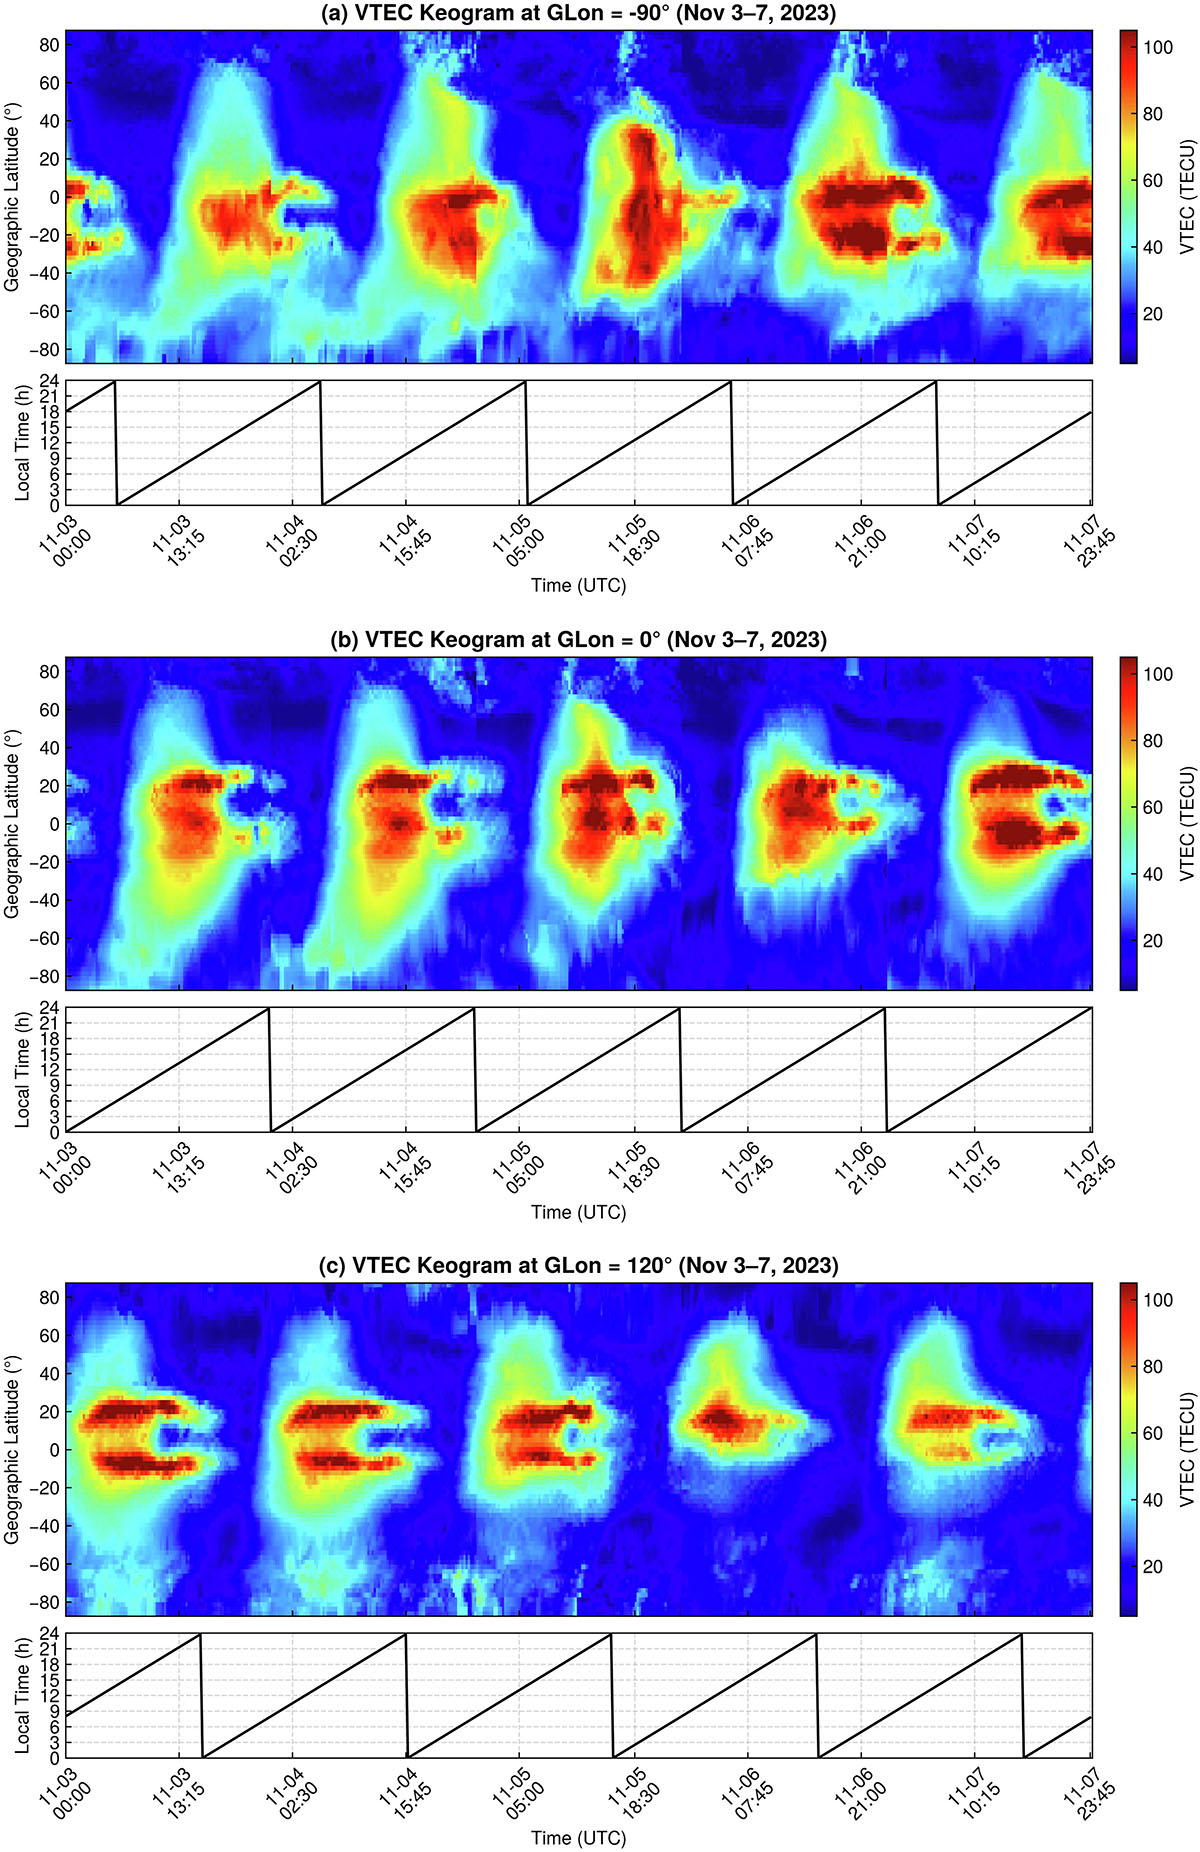
UQRG VTEC keograms for the American (a), European (b) and Australian (c) sectors during the period of the study. In the American sector, a notable superfountain effect was formed around 18-20 UT on 5 November (during the storm’s main phase consistent with PPEF action). In the Australian sector, one could observe merging of the EIA crests in the recovery phase of the storm, consistent with thermospheric changes (strongly depleted O/N2 ratios in the region).
Current usage metrics show cumulative count of Article Views (full-text article views including HTML views, PDF and ePub downloads, according to the available data) and Abstracts Views on Vision4Press platform.
Data correspond to usage on the plateform after 2015. The current usage metrics is available 48-96 hours after online publication and is updated daily on week days.
Initial download of the metrics may take a while.