Figure 3
Download original image
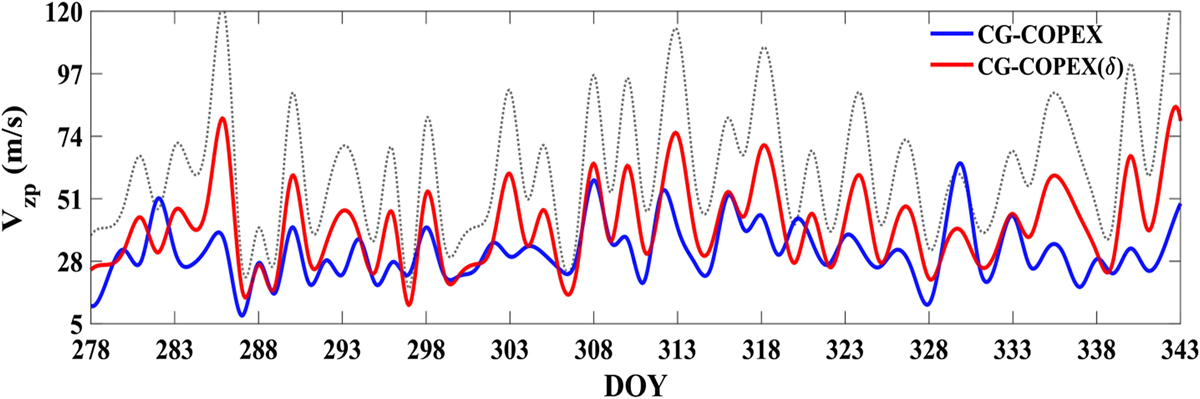
Comparison between the values of Vzp obtained over Campo Grande. Ionosonde measured values are presented in blue (CG-COPEX), and theoretical Vzp values are presented in red [CG-COPEX(δ)]. The theoretical Vzp values were obtained using the values from ionosonde data over Cachimbo equatorial station and the expression for δ. The gray dashed curve corresponds to the Vzp obtained from ionosonde over Cachimbo and is provided for reference.
Current usage metrics show cumulative count of Article Views (full-text article views including HTML views, PDF and ePub downloads, according to the available data) and Abstracts Views on Vision4Press platform.
Data correspond to usage on the plateform after 2015. The current usage metrics is available 48-96 hours after online publication and is updated daily on week days.
Initial download of the metrics may take a while.