Open Access
Figure 5
Download original image
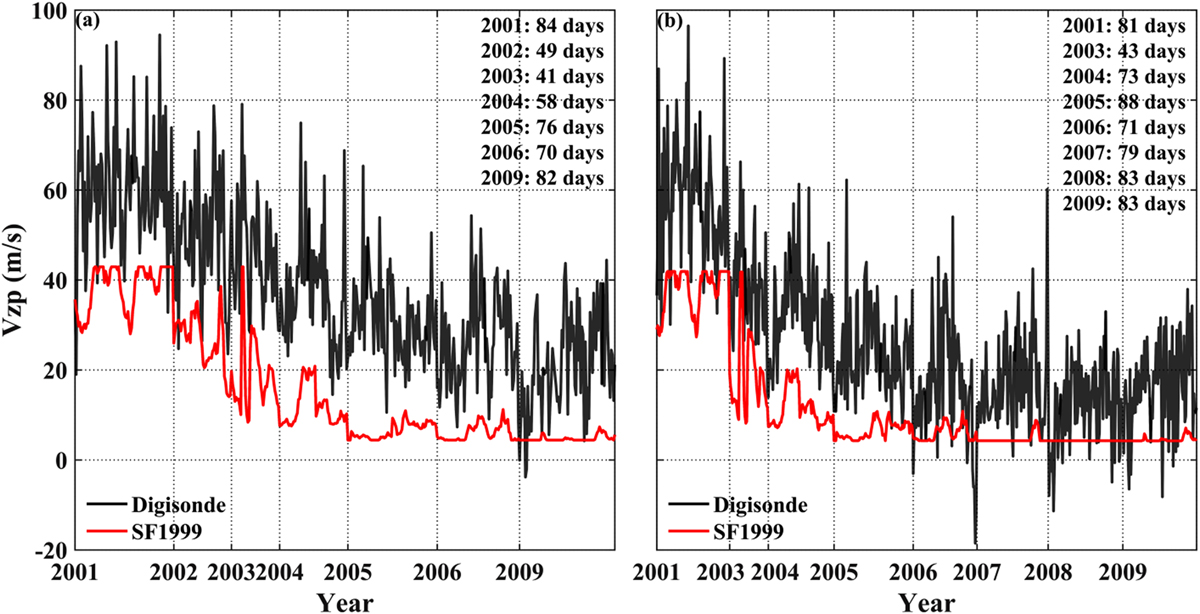
Vzp values as calculated from ionosondes data (black lines) and obtained from SF1999 model (red lines) for São Luís (a) and Fortaleza (b) stations. The data comprises from maximum to minimum of the solar cycle 23.
Current usage metrics show cumulative count of Article Views (full-text article views including HTML views, PDF and ePub downloads, according to the available data) and Abstracts Views on Vision4Press platform.
Data correspond to usage on the plateform after 2015. The current usage metrics is available 48-96 hours after online publication and is updated daily on week days.
Initial download of the metrics may take a while.